
SMA vs EMA: Which Moving Average Fits Your Trading?
A simple moving average weights every price equally; an exponential moving average weights recent prices more. Formulas, a worked example and when each fits.
The difference in SMA vs EMA is how they weight prices. A simple moving average (SMA) gives every price equal weight. An exponential moving average (EMA) weights recent prices more, using a multiplier of 2 ÷ (N + 1), so it reacts faster. Faster means earlier signals and more false ones; slower means smoother, later signals.
How each is calculated
SMA = sum of the last N closing prices ÷ N
EMA = previous EMA + multiplier × (today’s price − previous EMA), where multiplier = 2 ÷ (N + 1)
For a 10-period EMA, the multiplier is 2 ÷ 11 ≈ 0.18, so each new price moves the average 18% of the way toward it.
Worked example
Five closing prices: 100, 102, 104, 106, 120.
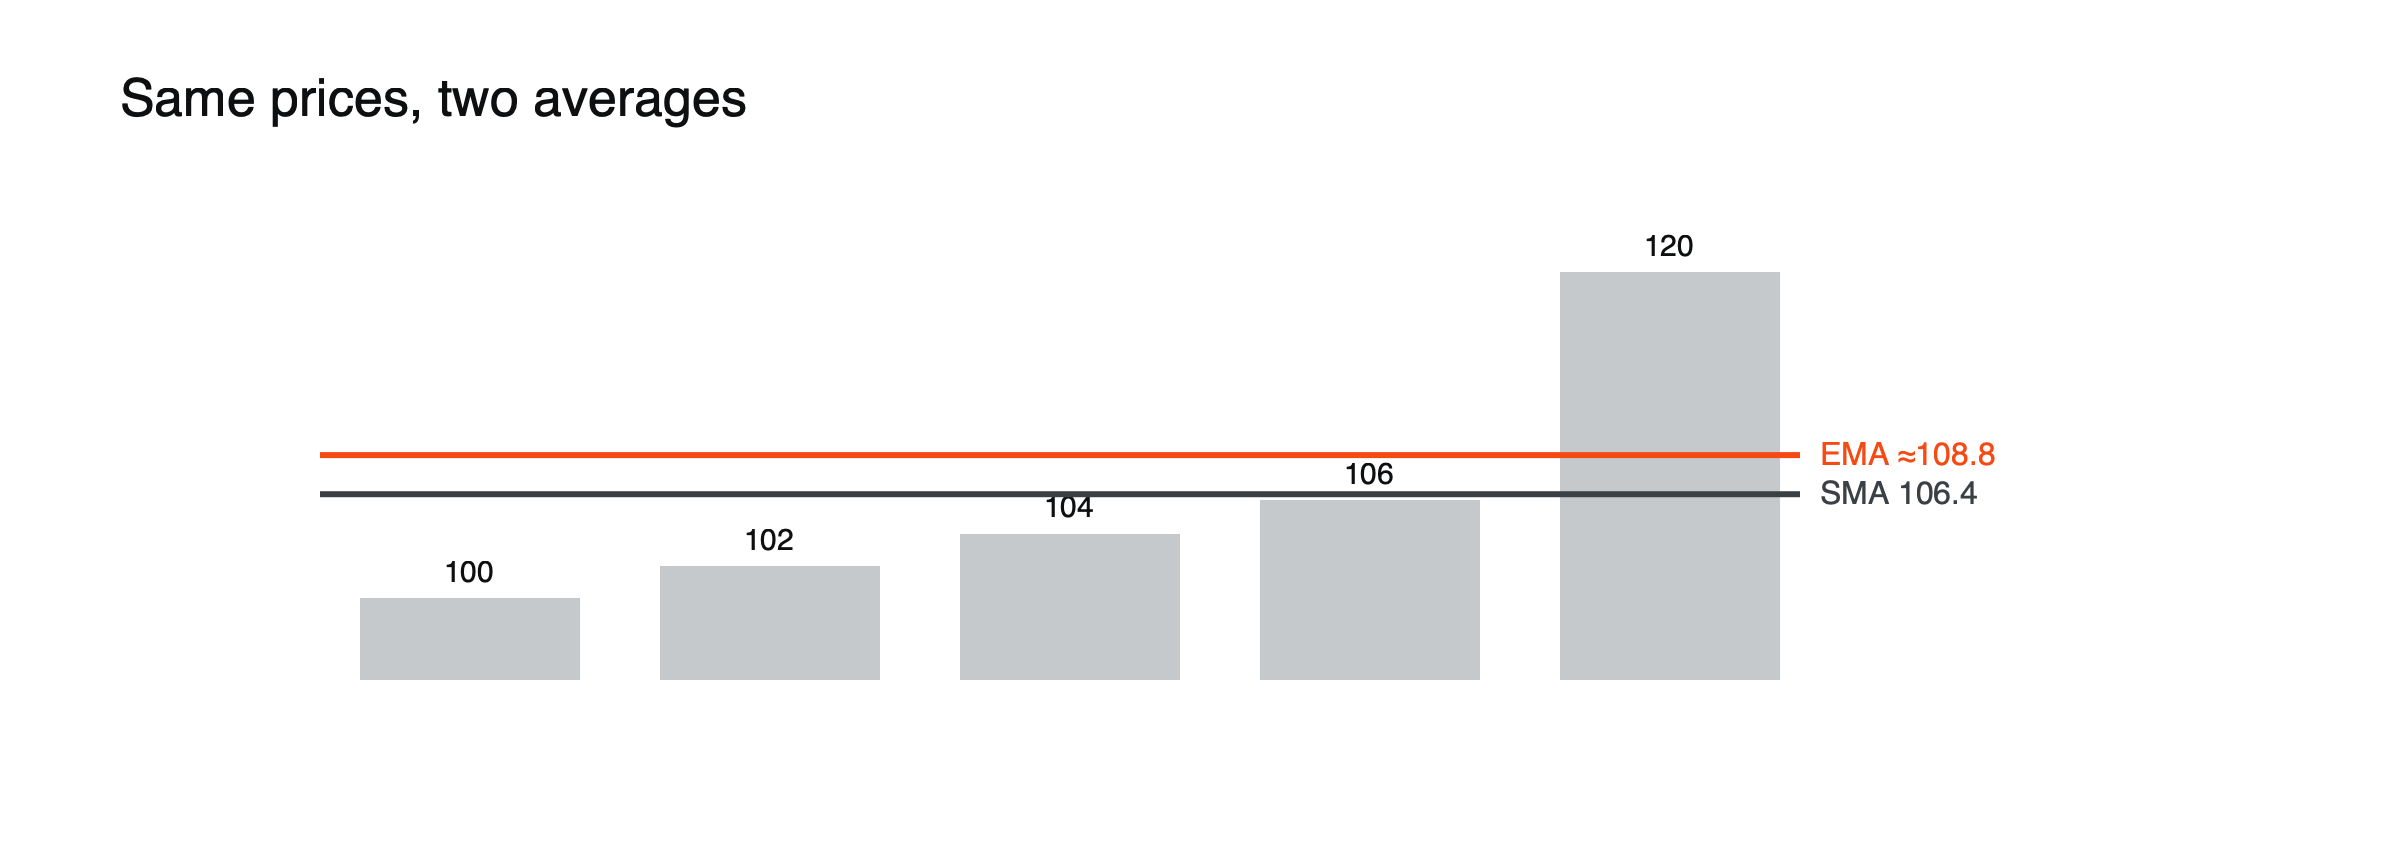
Figure: The EMA moves further toward the latest price than the SMA.
- 5-period SMA = (100 + 102 + 104 + 106 + 120) ÷ 5 = 106.4
- 5-period EMA (multiplier 2 ÷ 6, starting from 100) ≈ 108.8
The jump to 120 pulls the EMA further than the SMA, because the EMA weights the latest price more heavily.
Side by side
| SMA | EMA | |
|---|---|---|
| Weighting | Equal for all prices in the window | More weight on recent prices |
| Reaction to new moves | Slower | Faster |
| False signals | Fewer | More |
| Lag | More | Less |
| Common uses | Long-term trend (e.g. 200-period) | Short-term trend and entries |
When faster is worse
“EMA is better because it is faster” holds in trending markets, where reacting earlier pays off. In choppy, sideways markets, the EMA’s speed produces more whipsaws: crossovers that reverse almost immediately. There, a slower SMA can be the more useful filter.
Common periods
| Period | What traders usually use it for |
|---|---|
| 20 | Short-term trend, often on daily or hourly charts |
| 50 | Medium-term trend |
| 200 | Long-term trend; widely watched on daily charts |
Popular periods matter partly because so many traders watch them, which can make price reactions around them more likely.
Lag in numbers
A simple moving average’s center sits about halfway back in its window, so an N-period SMA lags price by roughly (N − 1) ÷ 2 periods. A 200-day SMA therefore reflects where prices were, on average, about 100 days earlier. An EMA of the same length lags less because recent prices carry more weight, but it still lags. The longer the period, the smoother the line and the later its signals.
Golden crosses and death crosses
When a 50-day average crosses above a 200-day average, traders call it a golden cross and read it as a sign of strengthening trend; the opposite is a death cross. Because both averages lag, these crossovers usually arrive well after a trend has begun, and in choppy markets they can flip back and forth. They describe what has already happened more reliably than they predict what comes next.
Candles in a market that never closes
Stock markets have a clear daily close; crypto trades around the clock. Most charting platforms use a set time, often midnight UTC, to define the daily candle, and moving averages are calculated from those closes. Different settings for the daily close produce slightly different averages, which is one more reason two charts of the same asset may not match exactly.
A crossover rule in a sideways market
Imagine a simple rule: buy when the 20-period EMA crosses above the 50-period EMA, and sell when it crosses below. (Illustrative scenario.) In a steady trend, the rule catches much of the move with a delay at each end. In a sideways market, the two averages weave around each other, producing a buy, then a sell, then another buy, each at a slightly worse price than the last. After fees and spreads, a few weeks of chop can erase gains made in the previous trend. This is why many traders add a filter, such as trading crossovers only when price is above a longer average.
Averages as trailing stops
Some traders use a moving average as a trailing exit: they hold a position while price stays above the average and close it after a close below. The choice of period decides the trade-off. A short average exits quickly and protects gains but gets shaken out by small pullbacks; a long one stays in through noise but gives back more of the move before exiting.
Matching the setting to your timeframe
Settings make sense only relative to the chart you trade. A 20-period average on a 15-minute chart covers five hours; on a daily chart it covers nearly three weeks. Choosing periods that fit how long you intend to hold, and testing them on past data, matters more than copying popular settings.
Moving averages and volatility bands
Moving averages also form the center of other tools. Bollinger Bands, for example, draw lines a set number of standard deviations above and below a simple moving average, usually 20 periods. When volatility rises the bands widen, and when it falls they narrow. Price touching a band is not a signal by itself, but long periods of narrow bands often precede large moves, and readings far outside the bands show unusual stretch. The same lag applies: the bands describe recent behavior rather than predicting the next move. Average True Range, another volatility measure, also uses a simple moving average of daily ranges and helps size stops to typical movement rather than to arbitrary round numbers.
How traders use moving averages
- Trend direction: price above a rising average suggests an uptrend.
- Dynamic support and resistance: averages often act as zones where price reacts. See support and resistance.
- Crossovers: a shorter average crossing above a longer one is read as momentum turning up.
Limits
All moving averages describe the past. They lag by design, and crypto’s sharp moves can make any crossover arrive after most of a move is over. Combine them with risk limits and other evidence. For momentum, see what RSI is, and for the basics, what spot trading is.
This article is educational content and does not constitute financial, investment, legal or tax advice. Digital assets are volatile and you may lose the amount you invest.
Other kinds of moving average
Beyond simple and exponential averages, traders use weighted moving averages, which assign linearly declining weights to older prices, and Wilder’s smoothing, used inside RSI, which reacts more slowly than a standard EMA of the same length. Each is a different trade-off between smoothness and speed.
Frequently asked questions
Should I use SMA or EMA?
It depends on what you want to see. EMAs suit shorter-term trading where reacting quickly matters; SMAs suit longer-term trend reading where fewer false signals matter more. Many traders use both, for different purposes.
Do moving averages work better in crypto than in stocks?
Not inherently. Crypto’s sharp moves can make averages lag more noticeably, and its 24-hour trading changes how daily values are defined. The same principles and limits apply.