
What Happened to Bitcoin After Each Halving?
Bitcoin halving history from 2012 to 2024: the price at each halving, the next cycle high, how long it took, and why four cycles are too few to call a rule.
Bitcoin halving history so far covers four events, in 2012, 2016, 2020 and 2024, and after each one the price reached a new all-time high within about 12 to 18 months. Each rally was smaller in percentage terms than the one before: roughly a hundredfold after 2012, about thirtyfold after 2016, under eightfold after 2020 and about twofold after 2024.
What a halving changes, mechanically
Every 210,000 blocks, roughly every four years, the number of new bitcoins paid to miners for each block is cut in half. With about 144 blocks mined a day, that changes the daily flow of new coins sharply:
| Halving | Block subsidy | New BTC per day (approximate) |
|---|---|---|
| Before 2012 | 50 → 25 | 7,200 → 3,600 |
| 2016 | 25 → 12.5 | 3,600 → 1,800 |
| 2020 | 12.5 → 6.25 | 1,800 → 900 |
| 2024 | 6.25 → 3.125 | 900 → 450 |
Miners’ revenue in bitcoin terms halves overnight, while their electricity and hardware costs do not. Less efficient miners can be pushed out, and the amount of newly mined coins that miners need to sell to cover costs falls. That reduced selling is the core of the argument that halvings support the price. See what the Bitcoin halving is and what determines Bitcoin mining profitability.
How miners absorb the shock
When a halving cuts revenue in half, miners with older machines or expensive electricity can fall below break-even and switch off. The network adjusts for this automatically: every 2,016 blocks, roughly every two weeks, the mining difficulty resets so that blocks keep arriving about every ten minutes. If enough miners leave, difficulty falls and the remaining ones earn a little more. The adjustment keeps the network running through each halving, but it also means mining becomes steadily more concentrated among operators with the cheapest power and newest hardware. See how Bitcoin mining difficulty works.
The four cycles at a glance
| Halving | Price around the halving | Next cycle high | Time from halving to high | Rise from halving price to high |
|---|---|---|---|---|
| November 2012 | About $12 | About $1,200 (late 2013) | About 12 months | Roughly 100x |
| July 2016 | About $650 | Just under $20,000 (December 2017) | About 17 months | Roughly 30x |
| May 2020 | About $8,800–$9,000 | About $69,000 (November 2021) | About 18 months | Roughly 7.7x |
| April 2024 | In the $60,000s | About $126,000 (October 2025) | About 18 months | Roughly 2x |
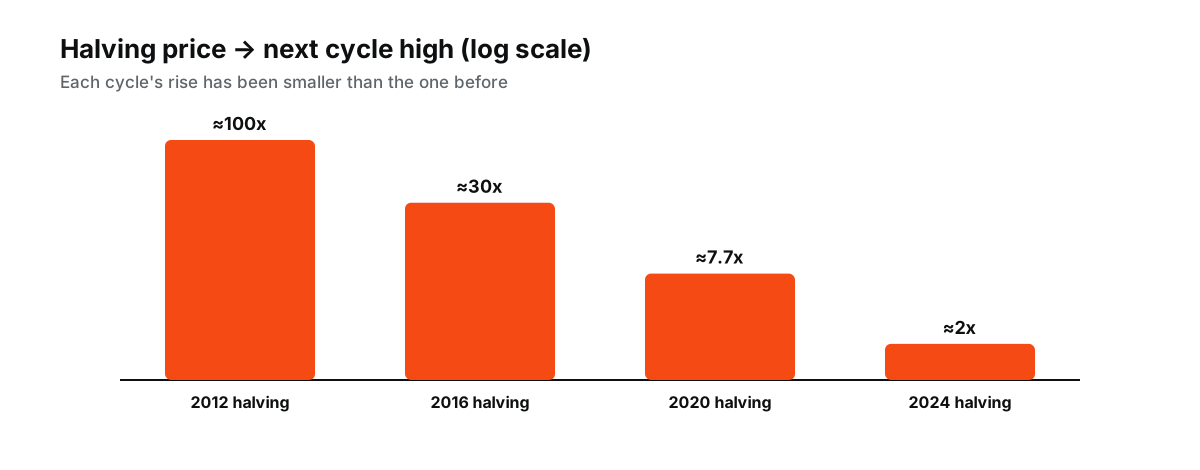
Figure: Rise from each halving to the next cycle high, log scale. Rounded figures from the table; past performance is not a guide to the future.
Prices are rounded and differ slightly between data providers and exchanges, so treat the multiples as approximate.
2012: the first halving
The first halving cut the block subsidy from 50 to 25 BTC on November 28, 2012. Bitcoin was a niche asset with a tiny market, trading at about $12. Over the next twelve months the price moved from roughly $13 to the mid-$700s, then spiked to around $1,200 in late 2013. That rally coincided with a surge of new attention and new exchanges, which makes it hard to say how much of it the halving itself caused.
2016: the second halving
On July 9, 2016, the subsidy fell from 25 to 12.5 BTC with the price around $650. The next high came in December 2017, just under $20,000, after a year in which crypto drew mainstream attention for the first time and new token sales flooded the market. Inside Bitcoin, the same period saw the fight over block size that ended with SegWit; see the Bitcoin block size war.
2020: the third halving
The May 11, 2020 halving took the subsidy from 12.5 to 6.25 BTC with bitcoin near $9,000, only two months after the March crash described in Black Thursday. The following cycle ran alongside very loose monetary policy and the first large wave of corporate and institutional buying, and peaked at about $69,000 in November 2021.
2024: the fourth halving
By April 20, 2024, when the subsidy dropped to 3.125 BTC, the price was already in the $60,000s and had set a new record of about $73,800 a month earlier, something no previous cycle had done before its halving. Large flows into newly approved US spot bitcoin funds were a major part of that run. The cycle high, about $126,000, came in October 2025, roughly 18 months after the halving.
What followed each peak
The pattern is not only about highs. Each peak was followed by a long and deep decline:
- After the December 2017 high, bitcoin fell about 84% by the end of 2018.
- After the November 2021 high, it fell about 77% by November 2022.
- After the October 2025 high, it fell roughly 47% to near $60,000 by early 2026.
Anyone using halvings to time purchases has had to sit through these declines as part of the same cycle. See crypto bull and bear markets.
What the pattern does and does not show
What it shows. In every cycle so far, a new high came after the halving rather than before it, and the time from halving to peak has clustered around 12 to 18 months. Returns have shrunk each time as the market has grown.
What it does not show. Four events are far too few to prove cause and effect. Each cycle overlapped with other forces: new investor groups, shifts in interest rates, regulation and, in 2024, a new class of investment products. The schedule is also public years in advance, so markets have every chance to price it in. And as each halving cuts new supply relative to the coins already in circulation, its effect on the overall supply becomes smaller.
Scarcity models and their limits
The halving schedule inspired valuation models that link bitcoin’s price to its scarcity, most famously the stock-to-flow model, which compares the existing supply with new issuance in the way analysts sometimes treat gold. Such models became popular during the 2020–2021 cycle because each halving makes bitcoin “scarcer” on that measure. Critics point out that they treat demand as constant: scarcity alone cannot set a price if fewer people want to buy. The shrinking returns from each cycle are consistent with that criticism, since supply has kept falling while the price response has kept getting smaller.
The next halving
The fifth halving is due at block 1,050,000, expected around 2028, when the subsidy will fall to 1.5625 BTC and daily issuance to roughly 225 BTC. By then, transaction fees will make up a larger share of miners’ income, which matters for how the network is secured over the long term. Treating that date as a reliable timing signal remains risky for all the reasons above.
Further out, the halvings continue until the subsidy becomes too small to divide, around the year 2140, when the last fraction of a bitcoin is expected to be mined. From then on, miners will be paid entirely by transaction fees. Whether fees alone can pay for enough mining to keep the network secure is one of the longest-running open questions in Bitcoin, and each halving brings it a step closer. See why there will only be 21 million bitcoin. See what moves the Bitcoin price for the other drivers that ran alongside every one of these cycles.
This article is educational content and does not constitute financial, investment, legal or tax advice. Digital assets are volatile and you may lose the amount you invest.
Sources
- Will Bitcoin Hit $100,000 in 2024? (prices at the 2012, 2016 and 2020 halvings and subsequent highs) — Nasdaq, 2024
- How $5,000 Invested at Each Bitcoin Halving Has Performed (2012–2013 move; 2025 high near $126,000) — Yahoo Finance
- Breaking: Bitcoin Halving Is Sealed After Mining of Block 840,000 (halving dates) — Finance Magnates, April 2024
- Bitcoin Halving Concludes Successfully as BTC Miner Rewards Reduce to 3.125 (pre-halving record of $73,777) — FXStreet, April 2024
- Bitcoin down 47% from $126,000 peak (2018 −84%, 2022 −77%, early 2026 near $60,000) — Analytics Insight, February 2026