
What Is On-Chain Analysis?
On-chain analysis studies public blockchain data, such as transfers, balances and holder cost basis, to understand market behavior. Key metrics and limits.
On-chain analysis is the study of public blockchain data, such as transfers, wallet balances, exchange flows and the price at which coins last moved, to understand what market participants are doing. Because every transaction on networks like Bitcoin is public, analysts can measure behavior that traditional markets keep private. The data is real; the interpretation is where mistakes happen.
What it measures
Flows. Coins moving onto or off exchanges. See what exchange inflows and outflows show.
Holder behavior. How long coins sit unmoved, and whether long-term holders are selling.
Cost basis and profit. The price at which coins last moved, used to estimate whether holders are in profit. See how bitcoin’s realized price is calculated and how MVRV is calculated.
Large holders. Activity of wallets holding big balances. See how to track crypto whale wallets.
Network activity. Transactions, active addresses and fees.
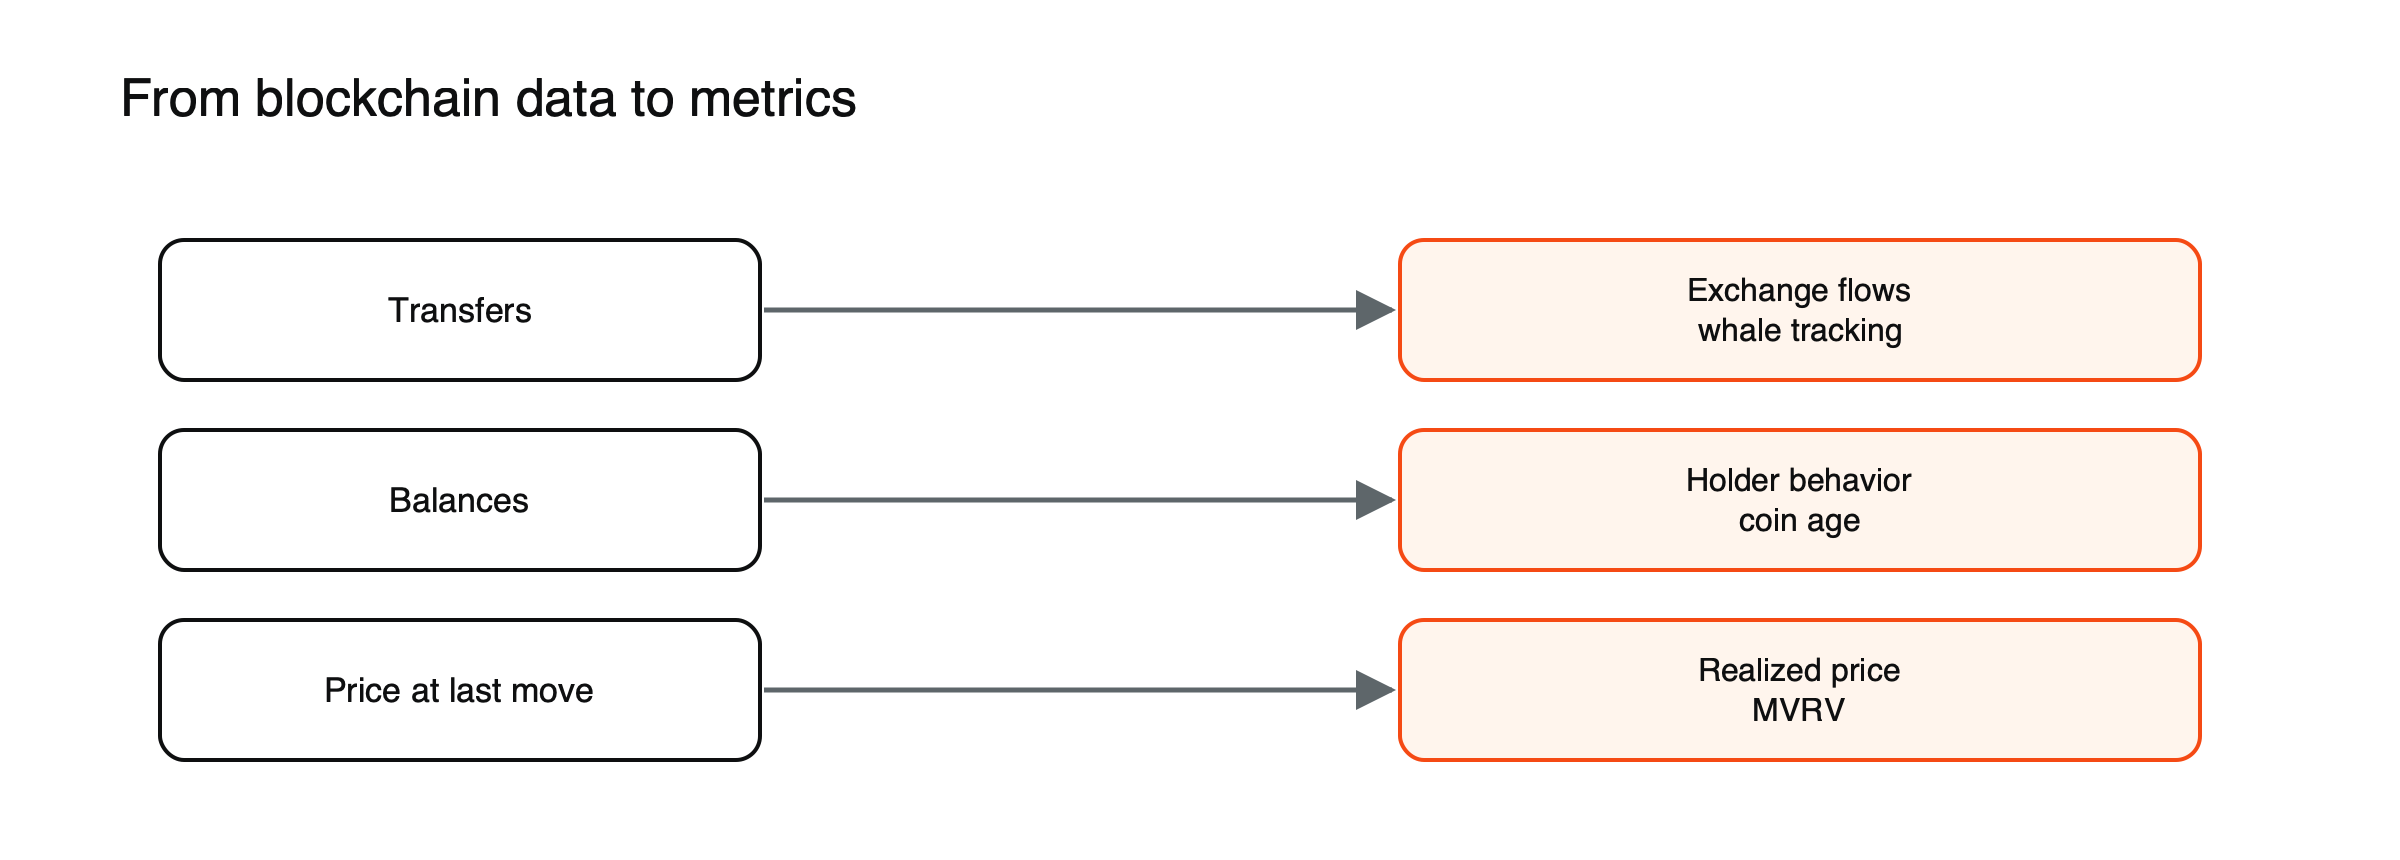
Figure: From raw blockchain data to common on-chain metrics.
Three questions on-chain data can help answer
Are holders accumulating or distributing? If coins that have not moved for years start moving to exchanges, long-term holders may be preparing to sell. If coins keep leaving exchanges for private wallets, holders may be settling in for longer.
How much profit or loss is sitting in the market? By estimating the price at which coins last moved, analysts can judge whether most holders are in profit, which can mean more sellers on rallies, or at a loss, which often coincides with exhausted selling near bottoms.
Is the network being used? Fees paid, active addresses and the value settled show whether demand for the network is growing, independently of the price.
Where the data comes from
You can read raw data yourself through a blockchain explorer. Analytics firms such as Glassnode and CryptoQuant clean it, label addresses that belong to exchanges and other entities, and publish metrics.
Raw data vs entity-adjusted data
A single person or company can control thousands of addresses, and a single exchange wallet can hold coins for millions of customers. Raw counts, such as “active addresses,” therefore mix real growth with internal reshuffling. Analytics firms cluster addresses that appear to belong to the same entity and publish “entity-adjusted” metrics, which better reflect the number of real participants. The adjustment relies on heuristics, so different providers can produce different numbers for the same metric.
A worked reading
Suppose bitcoin’s price has fallen 20% over a month. (Illustrative scenario.) On-chain data shows large net outflows from exchanges, the supply held by long-term holders rising, and fees steady. Read together, that suggests holders are moving coins into private custody rather than rushing to sell, a pattern often associated with accumulation. If instead the data showed long-dormant coins moving onto exchanges and inflows spiking, the same price fall would look more like distribution. Neither reading predicts the next move, but each changes how much weight to give the price chart alone.
Why it is useful
- It shows actual behavior, not surveys or opinions.
- Some metrics, such as MVRV, have marked past extremes in bitcoin’s cycles.
- It adds context to price charts: a fall with coins leaving exchanges looks different from a fall with coins flooding in.
Limits
- Labels are imperfect. Address labels are estimates; exchanges move coins between their own wallets, which can look like flows.
- Off-chain activity is invisible. Trades inside exchanges, ETFs and custodians do not appear on-chain.
- Small samples. Bitcoin has few complete cycles, so historical thresholds may not repeat.
Beyond Bitcoin
On-chain analysis applies to any public blockchain, though the useful metrics differ. On Ethereum and similar networks, analysts track fees and the ether burn, the amount staked, stablecoin supply and how much value is locked in decentralized applications. Stablecoin supply in particular is watched across the whole market: growing supply can signal new money arriving, and shrinking supply can signal money leaving crypto altogether.
Five metrics worth learning first
- Exchange net flow: whether coins are moving onto exchanges, often for sale, or off them. See what exchange inflows and outflows show.
- Long-term holder supply: how much of the supply has not moved for many months, and whether that share is rising or falling.
- Realized price and MVRV: the average cost basis of holders and how far the price is from it. See how bitcoin’s realized price is calculated.
- Stablecoin supply: a rough gauge of money available inside crypto markets.
- Fees and active entities: whether the network is actually being used.
Learning what each one shows, and how it can mislead, is more useful than following dozens of indicators. Watching them together over weeks gives a far clearer picture than any single day’s reading.
Free and paid tools
Block explorers are free and show raw transactions and balances. Several analytics sites publish basic charts of supply, flows and network activity at no cost. Detailed, entity-adjusted metrics and alerts usually sit behind paid subscriptions from firms such as Glassnode and CryptoQuant. For most individual investors, a handful of free charts and an understanding of their limits is enough. Before paying for data, it is worth checking whether the metric you want is entity-adjusted, how often it updates and how the provider labels exchange wallets, since these choices change what the chart shows.
See on-chain metrics traders misread most often. For the bigger picture, read what tokenomics is.
This article is educational content and does not constitute financial, investment, legal or tax advice. Digital assets are volatile and you may lose the amount you invest.
Frequently asked questions
Can on-chain analysis predict prices?
No reliably. It describes what holders have done, which can add context to a market’s mood and positioning. Prices also respond to news, macro conditions and off-chain trading that on-chain data does not capture.
Is on-chain analysis only for professionals?
No. Basic metrics such as exchange flows and supply held by long-term holders are widely published and easy to read. The skill is mostly in knowing their limits and not treating any single chart as a signal.
Sources
- Exchange Net Flow (internal wallet moves create misleading signals; cross-check providers) — BIT Knowledge Hub
- MVRV Ratio (realized cap as cost basis; extremes at tops and bottoms) — Glassnode documentation
- Exchange Flows (address labeling improves over time; internal wallet changes) — CryptoQuant user guide