
On-Chain Metrics Traders Misread Most Often
Every inflow as selling, fixed MVRV levels, ignored off-chain activity, single whale alerts, lost coins and overfitting: six on-chain metrics traders misread.
The on-chain metrics traders misread most are exchange flows, MVRV, whale alerts and realized price, usually because they treat estimates as facts. Inflows are not always selling, past MVRV peaks may not repeat, much trading happens off-chain and lost coins distort cost-basis measures. On-chain data is real; the interpretation is where mistakes happen.
Why misreadings are so common
On-chain charts look precise. They come with exact numbers, long histories and clean lines, so it is easy to forget that most of them rest on estimates: which addresses belong to which entities, which coins are lost, and what a transfer between two addresses actually means. Each case below starts with what a trader saw, then explains what was really going on.
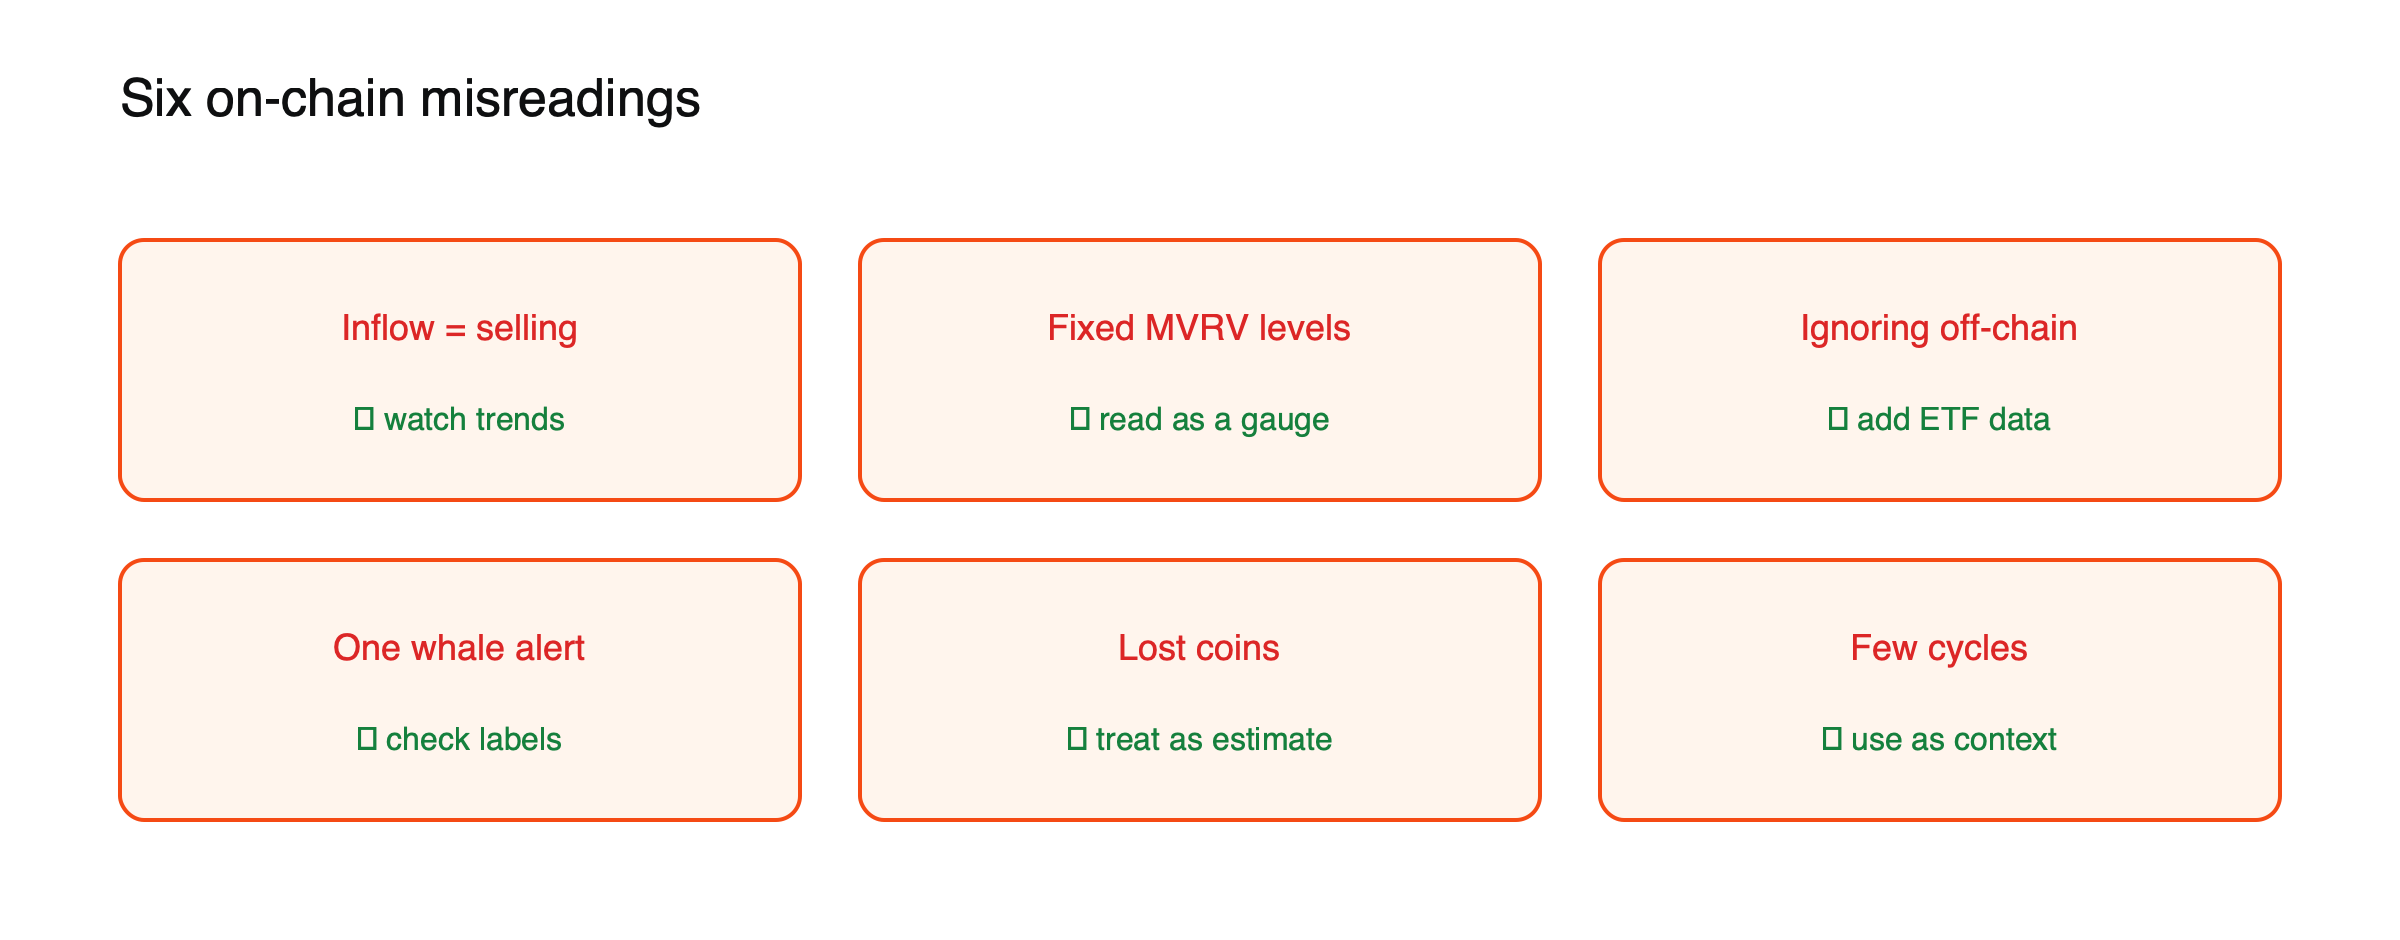
Figure: Six common misreadings and what to do instead.
An exchange inflow that was not selling
What the trader saw: a chart showing 40,000 BTC flowing into exchanges in a single day, read as a wave of selling about to hit the market.
What was happening: an exchange was moving coins from an address the analytics provider had not yet labeled into one it had, as part of a routine cold-storage rotation. On some charts it looked like a deposit; on others, with better labels, it did not appear at all. Inflows also include collateral deposits and transfers by market makers who move inventory between platforms. (Illustrative scenario.)
The lesson: a single day’s flow is rarely meaningful. Trends over weeks, confirmed by more than one provider, are much better. See what exchange inflows and outflows show.
Waiting for an MVRV level that never came
What the trader saw: MVRV had reached about 3.7 at two previous tops, so the plan was to hold until it got there again.
What was happening: MVRV peaks have been lower in each bitcoin cycle. As the market grows, more coins change hands at higher prices, which lifts realized cap and compresses the ratio. A top could form well below the old level, and the trader’s exit signal might never trigger.
The lesson: read MVRV as a gauge of how stretched profits are relative to history, not as a fixed price target. See how MVRV is calculated.
Ignoring the activity that never touches the chain
What the trader saw: flat exchange flows and quiet on-chain activity during a sharp price rise, read as a rally with no real buying behind it.
What was happening: most of the buying was taking place through spot ETFs and inside exchanges, where trades change ownership on internal ledgers without moving coins on the blockchain. The on-chain picture was accurate but incomplete.
The lesson: combine on-chain data with ETF flows, futures data and exchange volumes before deciding what a quiet chain means.
Panicking over a whale alert
What the trader saw: an automated alert reporting 10,000 BTC moved from an “unknown wallet,” shared widely on social media within minutes.
What was happening: a custodian was consolidating coins for an institutional client, moving them between its own addresses. Many alerts like this describe exchange reshuffles, custody changes or transfers between wallets belonging to the same owner.
The lesson: check where the coins went. A move to an exchange deposit address means more than a move to a fresh, unlabeled address. See how to track crypto whale wallets.
Treating realized price as a precise cost basis
What the trader saw: price approaching bitcoin’s realized price, read as the exact average cost of all holders and therefore a hard floor.
What was happening: realized price counts lost coins at the old prices when they last moved, which pulls the figure down; it misses coins bought inside exchanges or through ETFs; and it resets when holders simply move coins between their own wallets. It is a useful estimate, not a measured average.
The lesson: treat realized price as a zone with wide error bars. See how bitcoin’s realized price is calculated.
Building a strategy on three data points
What the trader saw: a metric that had marked the last three bitcoin tops, turned into a mechanical sell rule.
What was happening: bitcoin has only a handful of complete cycles. A pattern that has appeared three times can easily be coincidence, and each cycle has differed in its participants, products and pace. Rules fitted tightly to past data tend to fail on new data.
The lesson: use on-chain metrics as context alongside risk limits, not as standalone signals.
Counting addresses as if they were people
What the trader saw: a sharp jump in active addresses, read as a surge of new users.
What was happening: a single application had started splitting its users’ transactions across many fresh addresses, and an airdrop campaign had encouraged people to create extra wallets to qualify. One person can control thousands of addresses, and one exchange address can serve millions of customers.
The lesson: prefer entity-adjusted measures where they exist, and check whether a jump coincides with an airdrop, a new application or spam before treating it as adoption.
Comparing numbers across providers
What the trader saw: two dashboards showing different values for the same metric on the same day, and concluded one of them was wrong.
What was happening: providers label addresses differently, treat lost coins and exchange wallets in their own ways, and revise historical data as their labels improve. Both figures were reasonable estimates.
The lesson: pick one provider for tracking a trend over time, and use a second to confirm big moves rather than to compare exact levels.
A checklist before acting on an on-chain signal
- Is the move confirmed over days or weeks, not a single reading?
- Does more than one provider show the same picture?
- Could off-chain activity, such as ETFs or exchange-internal trading, explain it?
- Where did the coins actually go, and who is likely behind the addresses?
- Would the same reading have worked in more than a couple of past cycles?
- Does your position size still make sense if the signal is wrong?
For the basics, read what on-chain analysis is.
This article is educational content and does not constitute financial, investment, legal or tax advice. Digital assets are volatile and you may lose the amount you invest.