
What Is Support and Resistance?
Support and resistance are price zones where buying or selling has tended to stop a move. How traders find them, why broken levels switch roles and the limits.
Support and resistance are price zones where an asset’s move has tended to pause or reverse. Support sits below the price, where buyers have stepped in before; resistance sits above it, where sellers have. Traders use these zones to plan entries, exits and stop levels. They describe past behavior, not guarantees, and in crypto they break often.
Why these levels form
Markets have memory. Traders who missed buying at a low price may buy if the price returns there, creating support. Holders who bought at a high price may sell to break even when the price returns, creating resistance. Orders also cluster at round numbers and previous highs and lows.
How traders find them
- Previous swing highs and lows where price reversed more than once.
- Round numbers, which attract orders because they are easy to remember.
- Areas of heavy trading where many positions were opened.
- Moving averages and trendlines, which act as sloping or moving levels.
Levels are best treated as zones rather than exact prices, because price often overshoots slightly before reacting. Higher timeframes, such as weekly charts, usually matter more than short ones. See how to read candlestick charts.
Drawing a zone, worked through
Suppose bitcoin bounced three times in recent months from lows of about $58,200, $58,600 and $57,900. (Illustrative figures.) Rather than picking one of those prices, a trader would mark a support zone from roughly $57,900 to $58,600. A price that dips briefly to $57,700 and closes back inside the zone has not clearly broken support; a daily close well below $57,900, especially on rising volume, is a stronger sign that the zone has failed.
Held or broken?
Traders look for a few clues when price reaches a level. A decisive close beyond the zone on a higher timeframe matters more than a brief spike through it. Rising volume on the break suggests conviction; low volume suggests the move may fade. A retest, where price returns to the broken level and is rejected from the other side, is often treated as confirmation that support has turned into resistance or the reverse.
Role reversal
When support breaks, it often becomes resistance; when resistance breaks, it often becomes support. Buyers who bought at the old support may sell to break even when price returns to it, turning the level into a ceiling. This does not always happen cleanly.
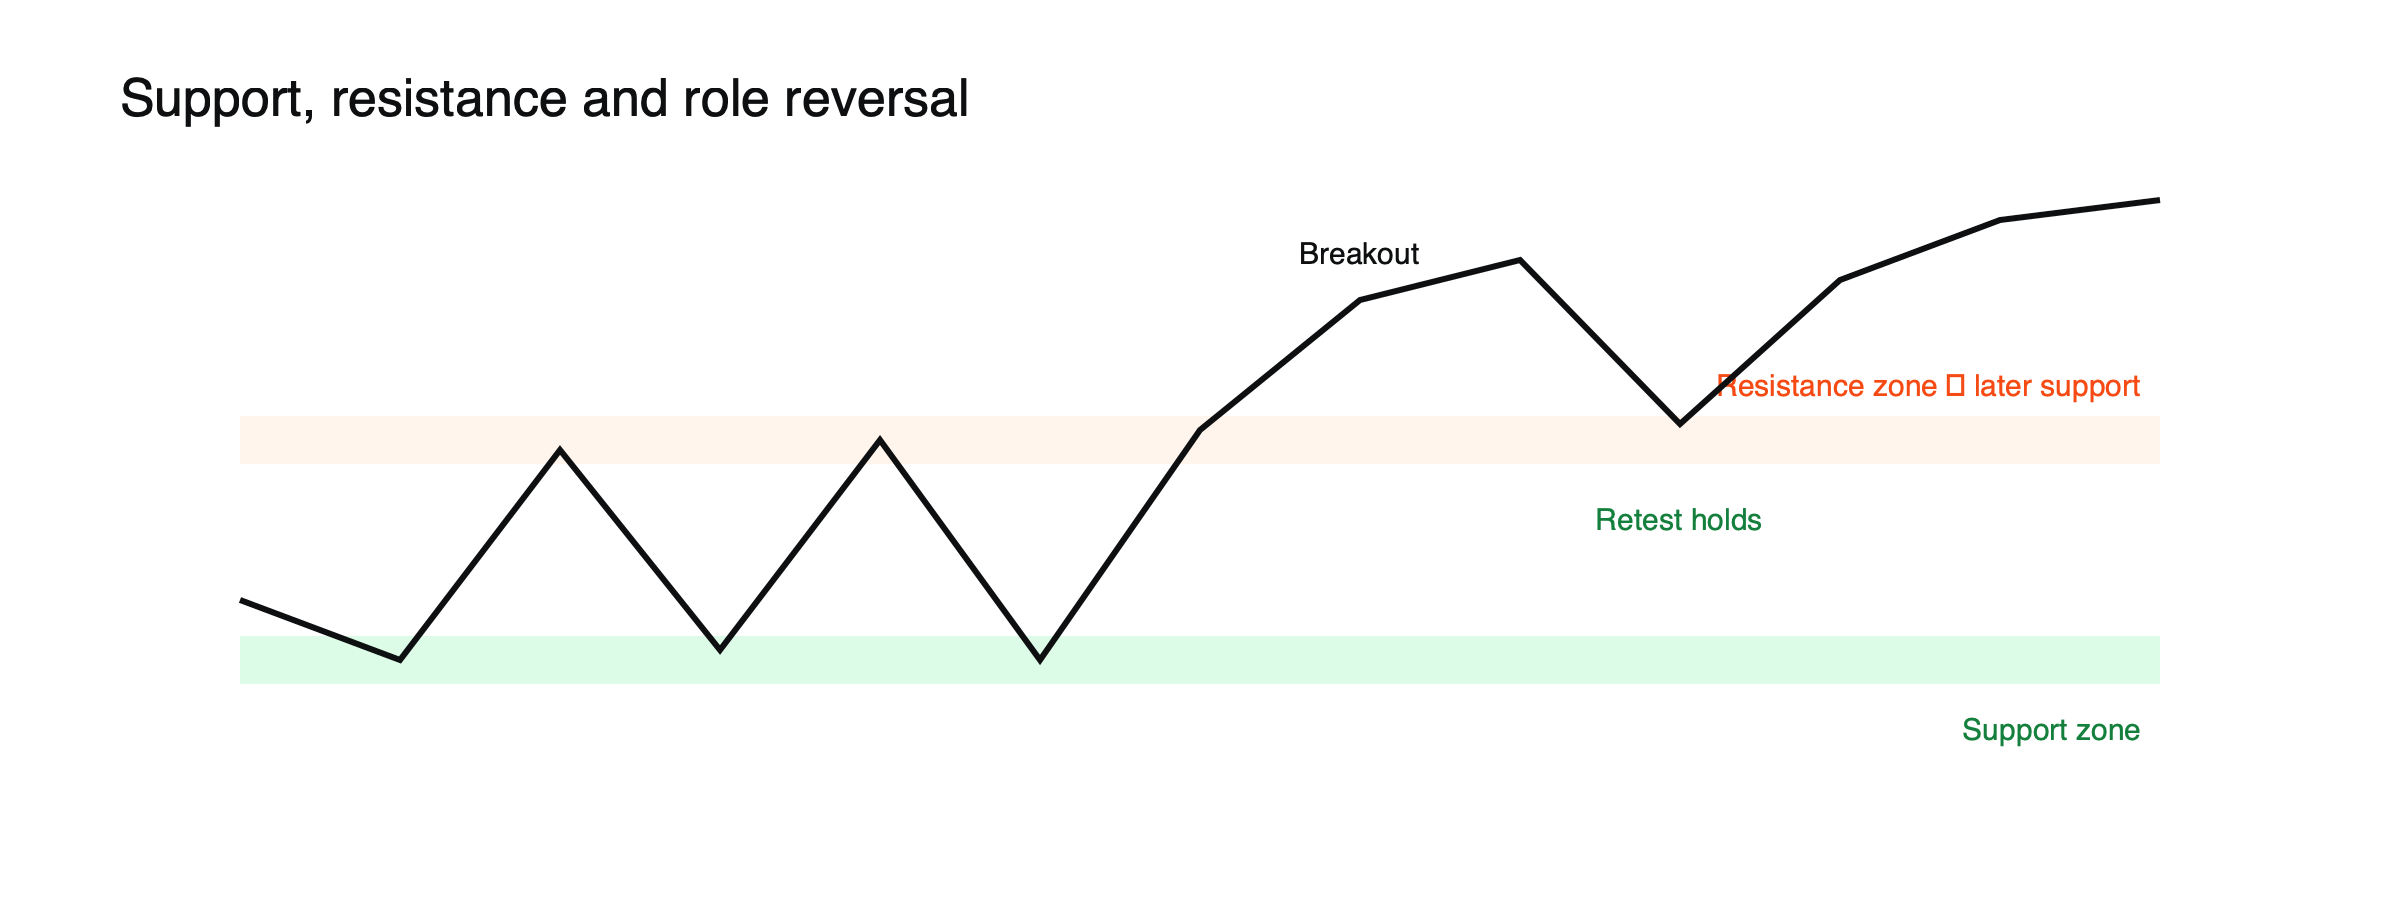
Figure: Support, resistance and role reversal (schematic).
Trendlines and channels
Not all support and resistance is flat. A rising trendline drawn under a series of higher lows acts as sloping support; a falling line across lower highs acts as sloping resistance. When parallel lines can be drawn along both highs and lows, the price is moving in a channel. Trendlines are more subjective than horizontal levels, since different traders anchor them to different points, so they are best treated as rough guides rather than precise boundaries.
Round numbers in crypto
Crypto prices often react around round numbers such as $50,000 or $100,000 for bitcoin, or $3,000 for ether. Many traders place orders there, media coverage focuses on them, and options often cluster at round strikes. A first approach to a major round number frequently brings volatility and hesitation before the price either breaks through or turns back.
Stops, invalidation and stop hunts
Many traders place stop orders just beyond support or resistance, which creates clusters of orders at predictable places. Sharp moves sometimes run through those clusters, triggering stops, before reversing, a pattern traders call a stop hunt or liquidity sweep. Placing a stop a little beyond the zone rather than at an obvious round number, and sizing the position so that the stop’s loss is acceptable, reduces the chance of being shaken out by noise.
Volume at price
Some charts show how much trading took place at each price level over a period, often called a volume profile. Prices where a lot of trading occurred tend to act as support or resistance, because many positions were opened there and their holders may react when price returns. It adds evidence about which levels matter most.
Levels as a planning tool
The most practical use of support and resistance is not predicting turns but planning trades. A level gives a reference point for where an idea is proved wrong, where to take profit and how large a position can be for a given risk. A trader buying near support with a stop below it knows the potential loss before entering. That discipline matters more than whether any particular level holds.
A trade plan around a level, worked through
Suppose bitcoin pulls back into a support zone around $58,200, and the nearest resistance sits near $62,000. (Illustrative figures.) A trader decides to buy at $58,200 with a stop at $57,400, below the zone, so the risk is $800 per bitcoin. The distance to resistance is $3,800, giving a potential reward about 4.75 times the risk. If the trader is willing to lose $200 on the idea, the position size is $200 ÷ $800 = 0.25 BTC. If support fails, the stop limits the loss to about $200 plus fees; if price reaches resistance, the gain is about $950. The level does not guarantee either outcome. It gives the trade a defined risk, a target and a size that fits the trader’s limits. Writing those numbers down before entering the trade, and checking them against the account’s overall risk limits, is exactly what turns a simple chart pattern into a plan. Without them, a level is just a line on a chart that quietly invites hope rather than any real discipline.
Limits in crypto
Crypto trades around the clock across many venues, with frequent large moves and leverage, so levels are often broken by sharp spikes before price returns. Liquidation cascades can drive price straight through levels that looked strong. See what causes liquidation cascades. Support and resistance work best combined with volume, risk limits and a plan for being wrong; see how to read trading volume.
For the bigger picture, read what spot trading is and what perpetual futures are.
This article is educational content and does not constitute financial, investment, legal or tax advice. Digital assets are volatile and you may lose the amount you invest.
Frequently asked questions
How many times must a level be tested to count?
There is no fixed number. Two or three clear reversals from the same zone are often treated as meaningful, but each test can also weaken a level as the orders defending it are used up.
Do support and resistance work on every timeframe?
They appear on every timeframe, but levels on daily and weekly charts usually carry more weight than those on minute charts, because more traders and more money are involved.