
Technical Analysis Mistakes Crypto Traders Make
Technical analysis mistakes and the biases behind them: confirmation, double counting, hindsight, overfitting, recency, anchoring and no exit plan.
The technical analysis mistakes crypto traders make most are stacking too many indicators, mixing up timeframes, selling every overbought reading, drawing lines to fit a view, ignoring volume and having no plan for being wrong. Most come from predictable thinking biases rather than from the tools themselves.
The problem is usually the reader, not the chart
Charts and indicators are neutral; they summarize what price has done. Mistakes come from how people read them. The same handful of mental shortcuts appear again and again: seeing what we want to see, counting the same evidence twice, trusting patterns that only work in hindsight. Naming the bias behind each mistake makes it easier to catch in the moment.
Confirmation bias: drawing the chart you want
It is easy to draw support exactly where you hope price will stop, or a trendline that conveniently supports the trade you already want to take. Lines drawn after the fact always look convincing. The counter is to mark levels only where price clearly reacted more than once, treat them as zones rather than exact prices and, before entering, ask what the chart would have to show to prove your view wrong. See what support and resistance are.
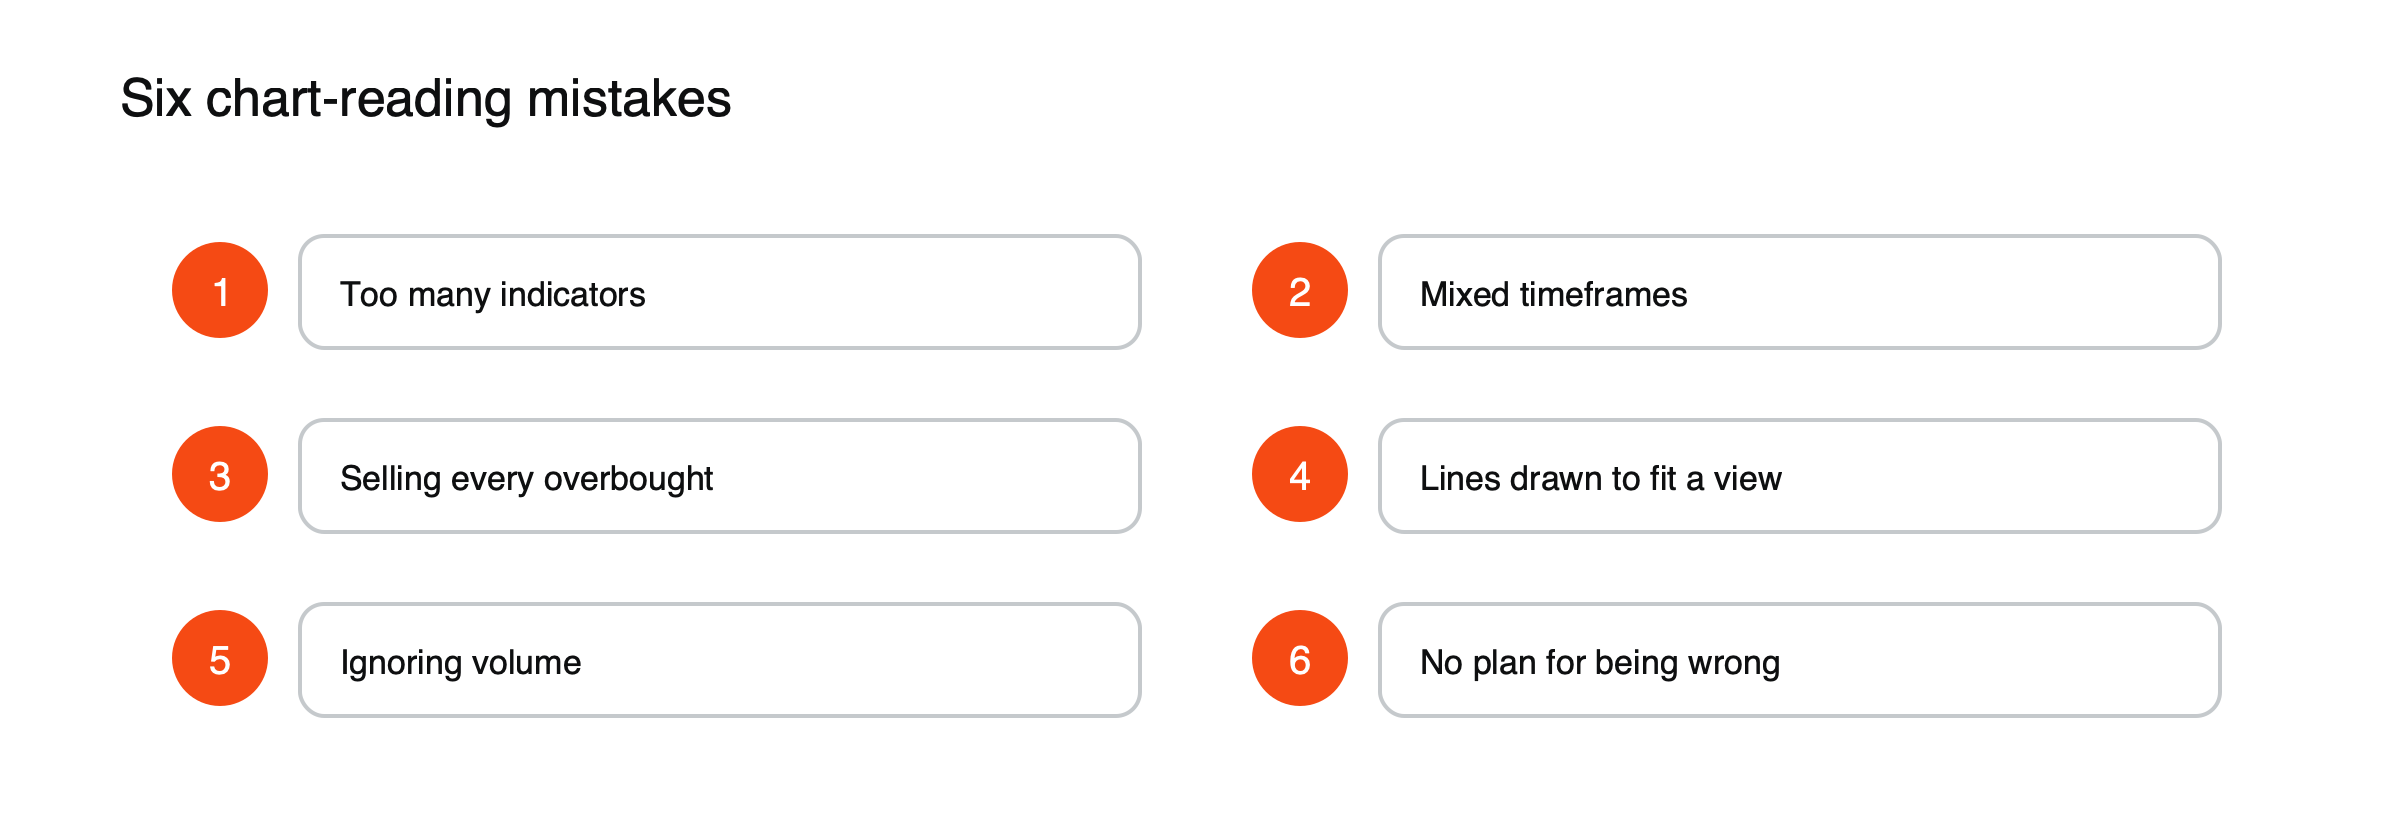
Figure: Six habits that make charts mislead.
Double counting: one signal, five indicators
Many indicators are built from the same price data, so RSI, a stochastic oscillator and a momentum line agreeing is often one piece of information counted three times. Adding more such tools creates false confidence rather than better evidence. A small set of tools that measure different things, such as trend, momentum and volume, gives more independent views of the market.
Hindsight bias: patterns that only work backward
Looking at an old chart, the right trade always seems obvious: the breakout that ran, the bottom that held. In real time, the same setup sat next to several that failed. Studying only the successful examples makes a pattern look more reliable than it is. Testing an idea on many past examples, including the ones that did not work, gives a truer sense of its odds.
Overfitting: settings tuned to the past
Adjusting indicator settings until they would have caught every past turn produces a system that fits history perfectly and the future poorly. A 17-period average that worked last year may have worked by chance. Simple, widely used settings and rules tested on data they were not designed around are more likely to hold up. See SMA vs EMA.
Recency bias: the last move feels like the next one
After a strong rally, every pullback looks like a buying chance; after a crash, every bounce looks like a trap. Recent moves weigh too heavily in how charts are read. This is one reason traders sell every overbought RSI reading in a strong uptrend, even though RSI can stay above 70 for weeks while price keeps rising. Reading indicators against the broader trend, rather than the last few candles, corrects for it. See what RSI is.
Anchoring: the price you bought at
The price you paid often becomes a reference point that the market does not care about. Traders hold losing positions waiting to get back to break-even, or take profits too early because a round number above their entry feels like enough. Basing decisions on current levels, trend and the plan you made, rather than on your own entry price, keeps the chart in charge.
Scope errors: the wrong timeframe
A breakout on a five-minute chart can sit inside a clear downtrend on the daily chart. Mixing timeframes, or switching to whichever one supports the trade you want, leads to contradictory decisions. Starting with the weekly or daily chart and moving to shorter ones only for timing keeps the bigger picture in view, since higher timeframes usually carry more weight.
Missing evidence: ignoring volume
A breakout without volume often fails, and some crypto volume is inflated. Reading price alone leaves out whether many participants are behind a move. Checking relative volume and order book depth adds a second, independent view. See how to read trading volume.
Survivorship bias: copying the winners
Social media is full of traders sharing charts that called a move perfectly. The thousands of similar calls that failed are rarely shared, so the visible record makes chart reading look far more reliable than it is. Following a public trader’s setups, or a pattern made famous by one spectacular success, means learning only from the survivors. Judging any method by its full record, losses included, or by your own tracked results, avoids the distortion.
The hope bias: no plan for being wrong
The most expensive mistake is entering a chart setup without deciding where it fails. Without a stop, hope fills the gap, and a small error becomes a large loss. Writing down the price that invalidates the setup, and how much you are willing to lose there, before entering, turns analysis into risk management.
Testing an idea honestly
The best defense against these biases is a fair test. Before trusting a chart setup, write down its exact rules: what must appear, where you would enter, where the stop goes and where you would take profit. Then go through past charts and record every instance that fits the rules, not just the memorable ones, noting the outcome of each. A few dozen examples is a minimum; fewer than that can look good or bad by chance. Next, follow the setup in real time with a very small position or on paper for a while, recording every signal as it happens. Results that hold up across both tests, after fees, deserve more trust than any single striking chart. Results that fade once you count all the examples tell you something just as valuable: that the pattern was mostly in the eye of the beholder. Keeping the test notes alongside your journal also lets you compare later live results with what the test promised, which shows quickly whether conditions have changed or the setup was weaker than it looked. Both are worth knowing before money is at stake.
A quick bias check before each trade
- Would I draw the same lines if I wanted the opposite trade?
- Are my signals independent, or the same data repeated?
- Have I looked at the setups that failed, not just the ones that worked?
- Does the higher timeframe agree?
- Is volume behind the move?
- Where exactly am I wrong, and what will that cost?
Technical analysis describes probabilities, not certainties. Used with these checks and firm risk limits, it can help structure decisions; used without them, it mostly lends confidence to guesses. Leverage magnifies every one of these errors, so the same discipline matters even more when trading perpetual futures.
This article is educational content and does not constitute financial, investment, legal or tax advice. Digital assets are volatile and you may lose the amount you invest.