
Why Bubbles Are So Hard to Spot in Real Time
Bubbles look obvious after they burst. In real time, strong fundamentals, changing discount rates and speculative behavior are hard to separate.
Market bubbles are hard to identify in real time because the same evidence can support two stories. Rapid price gains may reflect speculation, or they may reflect genuine changes in growth, technology, risk or interest rates. The distinction becomes clear after expectations fail. Before that point, even sophisticated valuation models depend on assumptions that can move.
A bubble is partly a claim about an unobservable fair value
Calling an asset expensive is easy. Calling it a bubble is harder.
A bubble usually means price has moved materially above a value justified by expected future cash flows, utility or economic fundamentals. The problem is that those fundamentals are not fully observable.
For a stock, investors have to estimate future revenue, margins, reinvestment needs, discount rates and risk. Small changes in those assumptions can produce large changes in estimated fair value, especially for assets whose expected cash flows sit far in the future.
For crypto assets, the problem can be even harder because there may be no conventional cash-flow model at all. Analysts may instead debate network use, scarcity, fee generation, monetary properties or demand for block space.
A price can therefore look irrational under one model and defensible under another.
The late 1990s show why fundamentals and speculation can coexist
The dot-com era is remembered as a textbook bubble, but the underlying technological change was real.
Internet adoption expanded rapidly. Computing and communications costs fell. New business models became possible. Productivity improved in parts of the economy. Capital spending on technology infrastructure surged.
At the same time, valuations in many technology and internet stocks moved far beyond what their eventual cash flows could support. Some companies with weak economics were funded simply because they were attached to the right theme.
That mixture is exactly why bubbles are difficult in real time. The question is rarely “is this technology real?” The harder question is “how much of the future has already been priced, and which companies will actually capture it?”
Ben Bernanke made a similar point in a 2002 Federal Reserve speech after the dot-com bust. He argued that the Fed could not reliably identify bubbles while they were forming because fundamental values depend on variables such as expected dividends and risk premiums that are themselves uncertain.
Price gains alone do not prove a bubble
A chart that has gone vertical makes people nervous. It is not enough evidence by itself.
Prices can rise sharply because earnings expectations rise, inflation changes, interest rates fall, a supply constraint appears or a market is repricing a structural shift. A powerful trend may later reverse without having been irrational at the start.
The reverse is also true. A slow and orderly market can contain serious vulnerability if leverage, credit growth or hidden concentration has built underneath the surface.
The IMF’s research on speculative bubbles emphasizes this problem. Price measures alone struggle to distinguish irrational exuberance from a rational response to lower perceived risk. Its proposed surveillance framework therefore combines price signals with quantities such as issuance, trading volume, fund flows and survey expectations.
Valuation ratios help, but every ratio needs a denominator story
Price-to-earnings, price-to-sales and market-cap-to-GDP ratios can show that an asset is expensive relative to history. They cannot tell you exactly when expensive becomes unstable.
The denominator changes.
A company growing earnings at 30% a year can justify a higher multiple than one growing at 3%. A lower risk-free rate can justify a higher present value for distant cash flows. A shift in market structure can change margins. Inflation can distort nominal comparisons.
This is why valuation is usually better at describing forward return risk than at timing the month a bubble breaks.
High valuations can persist for years. They can also become higher before correcting.
Bubbles often reveal themselves in quantities, not just prices
Some of the most useful warning signs sit outside the headline chart.
Watch for:
- rapid growth in leverage or margin debt;
- unusually weak lending or issuance standards;
- a flood of new supply from issuers trying to monetize demand;
- trading volume disconnected from long-term ownership;
- business plans built mainly on continued asset-price appreciation;
- narratives that treat financing conditions as permanent;
- investors abandoning normal valuation frameworks because “this time is different.”
None of those proves a bubble. Together they describe a market in which price is becoming increasingly dependent on new money and optimistic assumptions.
That is more useful than asking whether an index has risen too far.
Short selling does not make bubble detection easy
If an asset is obviously overpriced, why do skeptical investors not simply short it until the price falls?
Because being right about value is not the same as being right about timing.
A short position can lose money for a long time while the price continues rising. Borrow can become expensive or unavailable. Losses on a short are theoretically unlimited. Career risk matters to professional managers whose clients may not tolerate years of underperformance.
Those limits to arbitrage allow expensive assets to become more expensive before the market finally changes direction.
A bubble can therefore survive widespread skepticism.
Policy makers face an even harder version of the problem
A trader can choose not to participate. A central bank considering whether to respond to a suspected bubble has to weigh the cost of being wrong.
Bernanke’s 2002 argument was blunt: identifying a bubble requires not only estimating an uncertain fundamental value, but believing the central bank can do that better than the market. He also argued that interest rates are a blunt tool for targeting one asset market.
The Federal Reserve’s later financial-stability framework reflects the same caution. Rather than declaring a single asset definitively “in a bubble,” it monitors a range of valuation pressures and asks whether elevated prices interact with leverage, maturity transformation or weak risk management.
The vulnerability is often more important than the label.
A bubble becomes obvious when the financing mechanism breaks
Many bubbles end when the mechanism supporting them changes.
That can be:
- interest rates rising;
- credit becoming scarce;
- earnings failing to meet embedded expectations;
- new issuance overwhelming demand;
- a fraud or accounting problem damaging confidence;
- a technological narrative proving economically weaker than expected.
Once the feedback loop reverses, the evidence that was ambiguous on the way up becomes easier to interpret.
Investors who bought because prices kept rising now face falling collateral values. Companies that could finance losses easily have to conserve cash. Momentum turns from a source of demand into a source of supply.
Hindsight suddenly looks brilliant.
Better than declaring a bubble: map the conditions required for the price
A more useful approach is to ask what must remain true for today’s valuation to work.
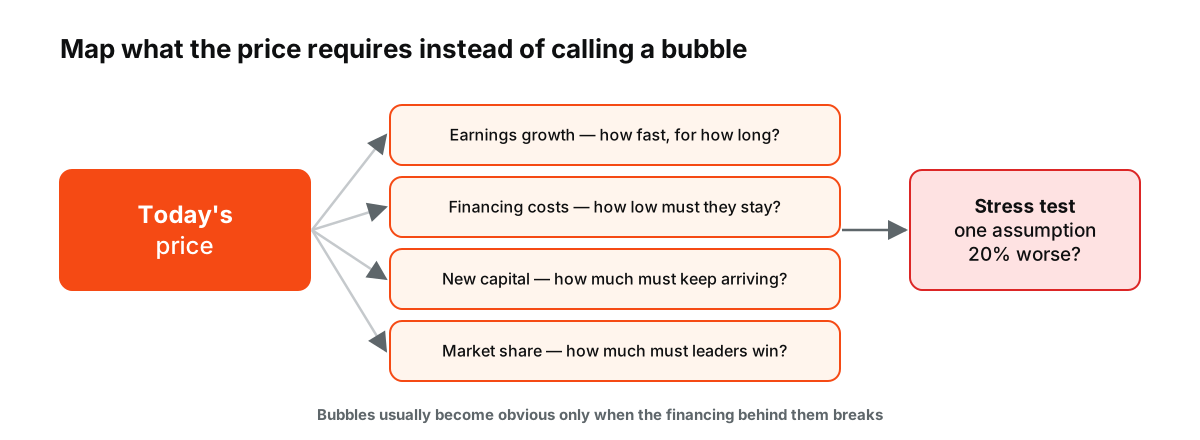
Figure: Instead of calling a bubble, list what the price requires and test what happens if one assumption is 20% less favorable.
How fast must earnings grow? How low must financing costs stay? How much new capital must continue entering? How much market share must the leading companies capture? What happens if one assumption is 20% less favorable?
This does not produce a dramatic “bubble or not” label. It produces something better: a map of the risks embedded in the price.
The market may still rise. The point is to understand what the price is asking the future to deliver.
Sources
- Identifying Speculative Bubbles: A Two-Pillar Surveillance Framework — IMF Working Paper, November 2014
- Asset-Price “Bubbles” and Monetary Policy — Federal Reserve, October 15, 2002
- Financial Stability Report: Asset Valuations — Federal Reserve, November 2020
- Natural Selection: Tactics and Strategy with Equity Sectors — S&P Dow Jones Indices, July 2024