
How to Read Your OTCN Account Statement
Check the period and currency, then deposits and withdrawals, closed trades, open positions, costs, balance and equity: how to read your OTCN statement.
To read your OTCN account statement, check the period and account currency first, then go through deposits and withdrawals, closed trades with their profit or loss, open positions at the statement date, overnight financing, commissions and other charges, and finally the closing balance, equity and margin figures. Reconciling these lines shows exactly where your results came from.
[PRODUCT FACTS SHEET — Open decision 3: every OTCN-specific step, screen name, fee, limit and time in this article is a placeholder marked PFS and must be confirmed before publishing.]
Before you start
Download the statement for the period you want. [PFS: where statements are found and available formats.]
Line by line
Period and currency
All figures are in the account currency; converted trades show the rate used.
Cash movements
Deposits and withdrawals for the period.
Closed trades
Each with open and close prices, size and profit or loss. See how CFD costs add up.
Open positions
Unrealized profit or loss at the statement date.
Costs
Financing, commissions and adjustments such as dividends or rollovers. See OTCN fees explained.
Balance, equity and margin
See equity, free margin and margin level explained.
Realized and unrealized
Realized profit or loss comes from closed trades and changes the account balance. Unrealized profit or loss comes from open positions and changes equity but not balance until the position is closed. Statements usually show both, and confusing them is one of the most common sources of misunderstanding.
Reconciling the numbers
Opening balance + deposits − withdrawals + closed profit and loss − costs should equal the closing balance; equity adds open profit or loss.
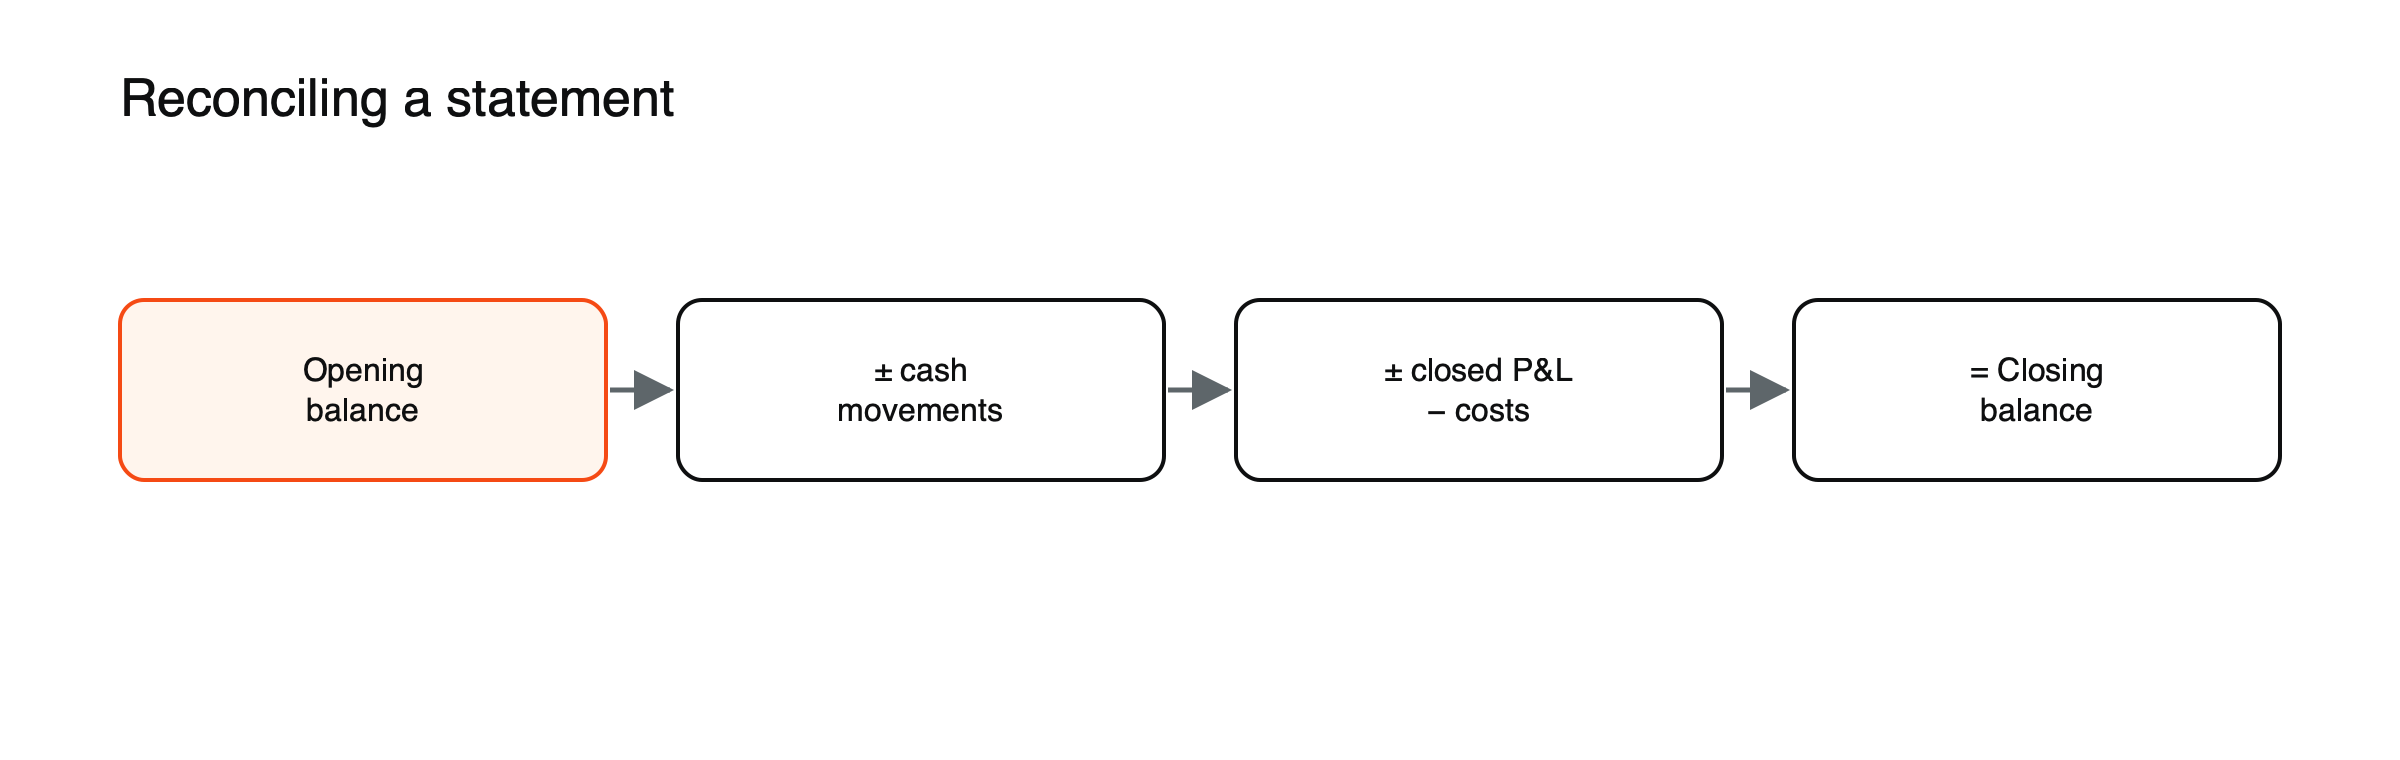
Figure: How statement lines reconcile.
A month reconciled, illustrated
Suppose a statement shows an opening balance of $3,000, a deposit of $1,000, a withdrawal of $500, closed-trade profit of $420, closed-trade losses of $610, overnight financing of $38 and commissions of $22. (Illustrative figures.) The closing balance is 3,000 + 1,000 − 500 + 420 − 610 − 38 − 22, or $3,250. If open positions show an unrealized loss of $150, equity is $3,100. If your figures do not match the statement, check for adjustments such as dividends on share or index CFDs, currency conversions or corrections.
Reading a financing line
Overnight financing is usually calculated as position value multiplied by the annual rate, divided by 365, for each night held. A $20,000 position financed at 6% a year costs about $3.29 per night, which looks small on a single line but adds up to about $99 over a month. See OTCN fees explained.
Common mistakes
Confusing balance with equity and ignoring small daily financing lines that add up. See how to open an OTCN account.
Corporate actions on the statement
Holding share or index CFDs through a dividend date usually creates an adjustment: long positions are credited and short positions debited an amount related to the dividend. These lines can surprise traders who did not expect them. Futures-based CFDs may also show rollover adjustments when contracts expire. [PFS: how OTCN shows dividend and rollover adjustments.]
Currency lines
If you trade instruments priced in a currency different from your account currency, profits and losses are converted, and the statement shows the rate used. Small differences between the rate applied and the market rate can add up over many trades. [PFS: OTCN conversion method.]
Spotting errors
Check that every deposit and withdrawal appears, that closed trades match your records and that charges match the published rates. If something looks wrong, contact support with the trade or transaction reference. Raising questions promptly makes them easier to resolve. See how to contact OTCN support safely.
Statements and tax
Statements are often the main record for reporting trading gains and losses. Keep them for as long as local tax rules require, and note that tax treatment of CFDs differs between countries.
Margin information
Statements usually show the margin used by open positions at the statement date, the free margin and the margin level, which is equity divided by used margin, expressed as a percentage. A falling margin level over several statements can signal that positions have become too large for the account. See equity, free margin and margin level explained.
Daily and monthly statements
Daily statements show each day’s activity in detail and are useful for checking specific trades and charges. Monthly statements summarize the period and are better for reviewing performance and keeping records. Reading both, at least occasionally, helps spot patterns that a single statement can hide.
Reviewing performance, illustrated
Suppose a month’s statement shows 20 closed trades: 9 winners averaging $80 and 11 losers averaging $60. (Illustrative figures.) The winners total $720 and the losers $660, a gross profit of $60. But financing of $45 and commissions of $40 turn the month into a $25 loss. The statement reveals that costs, not trading decisions alone, decided the outcome, which might prompt holding positions for shorter periods or trading less frequently.
Common misreadings
- Treating equity as money available to withdraw.
- Ignoring small charges because each line is small.
Statements for different products
Statements can look different depending on the products traded. Currency CFDs show financing at each rollover; share CFDs may show dividend adjustments and corporate actions; futures-based CFDs may show rollover adjustments when contracts change; crypto CFDs may show financing every day, including weekends. Understanding which lines belong to which product makes the statement easier to read.
How long to keep statements
Keep statements for as long as tax and legal rules in your country require, often several years. Downloading and storing them regularly protects you if access to the client area is ever interrupted.
A statement checklist
- Do opening and closing balances reconcile?
- Are all deposits and withdrawals listed?
- Do closed trades match my journal?
- Are financing and commissions in line with published rates?
- Are any unexpected adjustments explained?
Questions worth asking
Beyond checking accuracy, a statement can answer useful questions: which markets produce most of my profits and losses, how much of my result goes to costs and whether my position sizes have crept up over time. Reviewing statements monthly with these questions in mind turns them from paperwork into a learning tool.
Leverage on the statement, illustrated
Suppose a statement shows equity of $4,000 and open positions with a total value of $60,000. (Illustrative figures.) Effective leverage is 15:1, even if the account allows 30:1. If the previous month’s statement showed positions of $30,000 on similar equity, leverage has doubled, perhaps without a conscious decision. Tracking effective leverage from statements over time helps catch this kind of drift before it causes large losses. See leverage limits in the EU, UK and Australia compared.
Your equity curve
Plotting the closing balance or equity from each monthly statement produces an equity curve, a simple picture of how the account has developed. Long flat periods, steady declines or sudden drops are easier to see on a chart than in a table of numbers, and they can prompt a review of strategy or position sizing.
Sharing statements safely
If you share statements with a tax adviser or accountant, send them through secure channels and remove details that are not needed. Statements contain personal and financial information that fraudsters can use.
Statements and risk reviews
Many experienced traders set a monthly routine: download the statement, reconcile it, calculate effective leverage and costs as a share of profit or loss and compare the results with their trading plan. Spending an hour on this each month can reveal problems, such as rising costs or growing positions, long before they show up as large losses. Keeping the review notes alongside the statements creates a record of how trading decisions have evolved over time.
When the statement and platform disagree
The platform shows live figures, while the statement is a snapshot at a fixed time, often the end of the trading day. Small differences between them are usually timing differences, such as financing applied after the snapshot or prices moving after the close. If differences persist even after the next daily statement, ask support to explain them in detail. [PFS: OTCN statement cut-off time.]
Frequently asked questions
Why does my balance differ from my equity?
Balance excludes open positions; equity includes their unrealized profit or loss.
How often are statements issued?
Many providers issue daily and monthly statements, with history available in the client area. [PFS: OTCN statement frequency and formats.]
[RISK WARNING — Open decision 2: approved CFD and leverage risk warning to be inserted here before publishing.]
This article is educational content and does not constitute financial, investment, legal or tax advice. Digital assets are volatile and you may lose the amount you invest.