
Which Cross-Asset Signals Tend to Lead Stocks?
Credit spreads, the yield curve, the dollar and the copper-gold ratio are watched as early warnings for stocks. What each has shown and how reliable it is.
The cross-asset signals most watched for clues about stocks are credit spreads, the yield curve, the dollar and the copper-gold ratio. Credit spreads have the strongest record: high-yield spreads widened before every US recession since 1996 in one dataset. None is reliable enough to time markets alone, and several have broken down in recent years.
Credit spreads
When corporate bond spreads widen, bond investors are pricing more risk. Widening has typically come three to nine months before recessions. See what credit spreads tell equity traders.
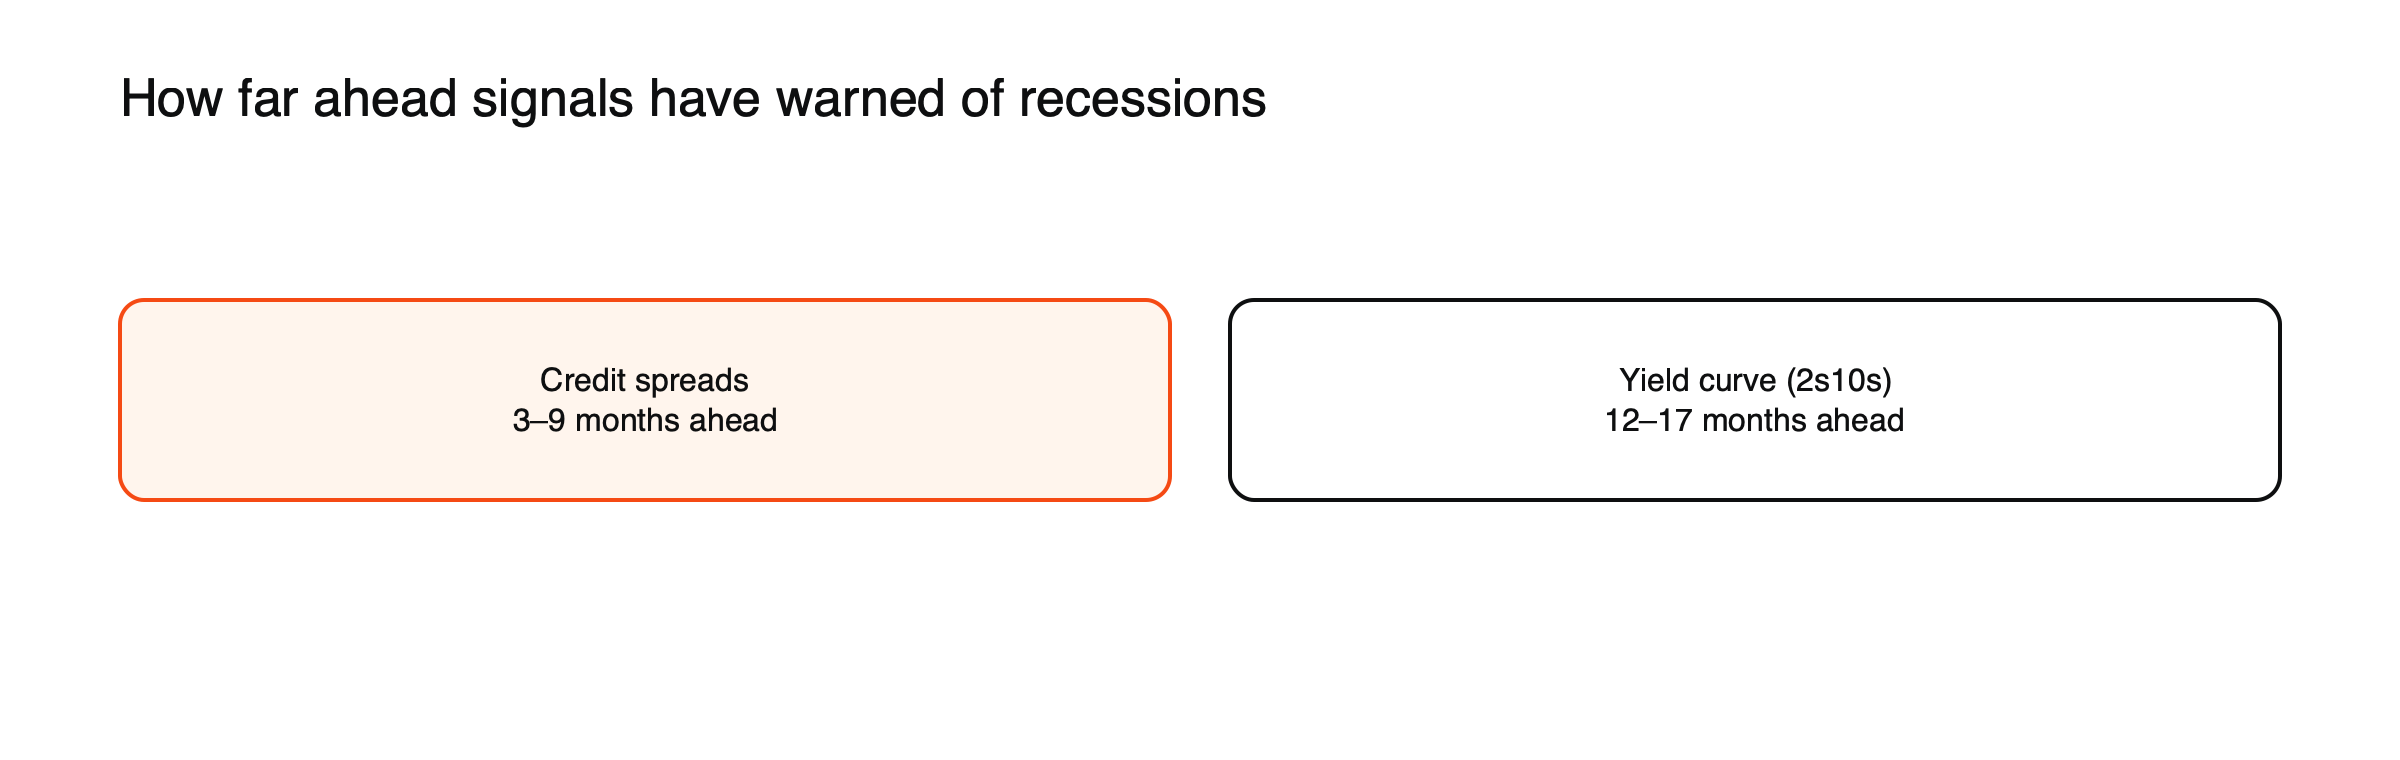
Figure: Typical lead times before US recessions. Source: Eco3min analysis of FRED data.
A spread warning, illustrated
Suppose high-yield spreads have been near 3% for a year and then widen to 4.5% over two months, while the S&P 500 is still near its highs. (Illustrative scenario.) Credit investors are demanding more compensation for lending to weaker companies, perhaps because defaults are rising in one sector or banks are tightening credit. In past cycles, such divergences have often been resolved by shares catching down, though false alarms happen. In July 2026, spreads were around 2.7 percentage points, near multi-year lows.
The yield curve
When short-term yields rise above long-term yields, markets expect rate cuts and slower growth. Inversion has historically led recessions by longer than spreads, about 12 to 17 months for the 2-year/10-year curve in one comparison, which makes it less useful for timing.
The latest test
The 2-year/10-year curve inverted in July 2022 and stayed inverted for 26 months, the longest inversion in decades, but as of 2026 no US recession had followed. Shares rose strongly through much of the inversion. The episode showed that even a long-respected signal can mislead, and why investors combine it with other indicators. See what an inverted yield curve means.
The dollar
A rapidly strengthening dollar has often signaled tighter global financial conditions, which weigh on risk assets, emerging markets and crypto. See how a strong dollar hits commodities, emerging markets and crypto.
The copper-gold ratio
Copper tracks industrial demand; gold tracks safety demand. For years the ratio moved with the 10-year Treasury yield, but since 2024 it diverged as central banks bought gold, and investor Jeffrey Gundlach, who popularized the link, called its use for forecasting yields a failure. See what the copper-gold ratio says about growth expectations.
Signals inside the stock market
Some of the most useful signals come from within equities. Cyclical sectors, such as industrials, materials and consumer discretionary, tend to lag defensive sectors, such as utilities and consumer staples, before slowdowns. Small caps, more sensitive to credit and domestic growth, often weaken before large caps. Narrowing market breadth, with fewer stocks driving gains, can signal fragility. See what sector rotation is.
Volatility signals
The VIX usually rises when shares fall, so it is more a coincident gauge than a leading one. But its term structure, the difference between short-term and longer-term implied volatility, can be informative: when short-term volatility rises above longer-term levels, markets are pricing immediate stress. See what the VIX is.
How to use them
Look for agreement across several signals rather than one, and treat them as risk gauges rather than predictions. A tight spread, steep curve and steady dollar suggest calm conditions; several turning at once deserve attention. For context, read why correlations go to one in a crisis.
A dashboard, illustrated
| Signal | Calm reading | Warning reading |
|---|---|---|
| High-yield spreads | Tight and stable | Widening quickly from lows |
| 2s10s yield curve | Positive and stable | Inverted, or re-steepening as cuts begin |
| Dollar index | Stable or falling | Rising sharply |
| Copper-gold ratio | Rising | Falling on weak copper demand |
| Cyclicals vs defensives | Cyclicals leading | Defensives leading |
| Small caps vs large caps | Small caps keeping pace | Small caps lagging |
(General tendencies.) One warning reading is common and often harmless; several together have historically deserved more attention.
Economic data
Cross-asset signals work best alongside economic data. Purchasing managers’ surveys, unemployment claims and corporate earnings revisions all provide confirmation or contradiction. A widening spread backed by rising unemployment claims is more convincing than either alone. See recession indicators and their track record.
Why no signal is reliable alone
Each signal reflects its own market’s quirks: central bank gold buying distorts the copper-gold ratio, central bank bond buying distorts the yield curve, and sector problems can widen spreads without a broad downturn. Markets also adapt: once a signal becomes widely followed, investors may act on it earlier, changing its timing.
Leading, coincident and lagging
Indicators differ in timing. Leading indicators, such as credit spreads, the yield curve and new orders surveys, tend to turn before the economy. Coincident indicators, such as industrial production and employment, move with it. Lagging indicators, such as unemployment duration and some inflation measures, turn after. For traders, leading indicators matter most, but they are also the noisiest.
False signals
Every signal has given false alarms. High-yield spreads widened sharply in 2015 and 2016 as oil prices collapsed, without a US recession. The yield curve inverted from 2022 to 2024 without one, as of 2026. The copper-gold ratio fell for reasons unrelated to growth after central banks began buying gold heavily. Treating any single signal as decisive has repeatedly led to costly mistakes.
Global signals
Some signals come from outside the United States: South Korean exports, often reported early, give a timely read on global trade; emerging market currencies reflect global risk appetite; and German Bund yields signal European growth expectations. Watching these alongside US indicators gives a fuller picture.
From signals to action
Most investors use leading indicators to adjust risk gradually rather than to make all-or-nothing decisions. When several signals turn negative together, they might reduce leverage, trim cyclical exposure or add high-quality bonds; when signals improve, they reverse those steps. Gradual changes limit the damage from false alarms.
Common misreadings
- Selling everything on one warning signal.
- Ignoring signals because the last warning was wrong.
A signal scorecard, illustrated
One simple approach gives each of six signals a score of 0 for calm, 1 for caution and 2 for warning: credit spreads, the yield curve, the dollar, the copper-gold ratio, cyclicals versus defensives and small caps versus large caps. (Illustrative method.) A total of 0 to 3 suggests normal conditions, 4 to 7 a reason to review risk and 8 or more a reason to reduce it. The scorecard forces a broader view than any single signal and makes changes in conditions easier to track week by week.
How professionals combine signals
Many institutional investors build composite indicators that combine financial and economic signals into one measure of financial conditions or recession risk. Central banks publish similar indices. These composites reduce noise but can lag, so professionals still watch the individual parts for early changes.
Signals and sectors
Leading indicators often show up first in particular sectors. Housebuilders and banks react early to changes in rates and credit; transport and industrial companies to changes in trade and activity; semiconductor companies to changes in technology spending. Watching these sectors alongside cross-asset signals can give an earlier read on the economy than broad indices.
Keeping a signal journal
Recording the readings of key signals each week, along with a short note on what they suggested, helps traders see how signals behave over time and how reliable their own interpretations have been. Over a year or two, the journal shows which signals gave useful warnings and which mainly produced noise, making future decisions more grounded. It also reduces the temptation to remember only the signals that turned out right.
Signals in 2026
In 2026, signals sent mixed messages: high-yield spreads were near multi-year lows, suggesting confidence, while the yield curve’s long inversion had not been followed by a recession, and the copper-gold ratio was distorted by record copper prices and heavy central bank gold buying. Mixed readings like these are common and argue for patience rather than dramatic moves. They also show why a dashboard of several signals is more informative than any single chart, since each reading must be interpreted in light of the forces specific to its own market. Revisiting the dashboard as each reading changes, rather than reacting to one alarming headline, keeps decisions consistent over time. It also makes it easier to explain, later, why a particular position was increased or reduced.
Frequently asked questions
Which signal has the best record?
Credit spreads, in many studies, because bond investors focus on default risk. But they too give false alarms.
How often should I check these signals?
Weekly is enough for most traders; daily checks can add noise without adding information.
This article is educational content and does not constitute financial, investment, legal or tax advice. Digital assets are volatile and you may lose the amount you invest.
Sources
- What are credit spreads and why do they predict recessions? (widened before every US recession since 1996; 3–9 months vs 12–17 months for the 2s10s curve) — Eco3min
- The Copper-Gold Ratio as a Macro Signal (divergence since 2024; Gundlach called its use a failure) — Eco3min
- The Dollar Index (inverse relationship with risk assets) — BIT Knowledge Hub
- Bond credit spread (US high-yield OAS 1,087 bp on March 23, 2020; about 270 bp on July 10, 2026) — BIT Knowledge Hub
- 2s10s yield curve inversion history (26-month 2022–2024 inversion without a recession as of 2026) — Eco3min