
What Is a Crypto Market Cycle?
A crypto market cycle is the repeating swing from accumulation to boom, distribution and bust. Learn the four phases, what drives them and their limits.

A crypto market cycle is the repeating pattern in which prices, trading activity and sentiment rise together, peak, fall and then stabilize before the next rise. It is usually described in four phases: accumulation, markup, distribution and markdown. The pattern is clear in hindsight, but the length and depth of each phase change every time.
Where the four-phase model comes from
The phase names come from the work of Richard Wyckoff, a market analyst in the early 20th century who studied how large investors build and unwind positions in stocks. His idea was that prices move in recognizable stages as informed buyers accumulate, the public follows, informed holders sell, and the public is left holding the decline. Crypto has proved a vivid example, because its cycles are fast, deep and heavily driven by sentiment.
The four phases
Accumulation
Prices have stopped falling and move sideways in a range. Volume is low, media attention is gone and buying comes mostly from long-term holders who think the asset is cheap. It often feels like nothing is happening, which is exactly why few people notice it.
Markup
Prices break out of the range and start making higher highs. New buyers arrive, leverage grows, and attention spreads from bitcoin to smaller coins. Each pullback is bought, and confidence builds with every new high.
Distribution
Prices rise more slowly or swing wildly near the top. Early buyers sell into strong demand, new token launches multiply and optimism is at its peak. The market can look strongest at the moment it is most fragile.
Markdown
Selling outweighs buying. Leverage is forced out through liquidations, weaker projects fail, and prices fall until sellers are exhausted and a new accumulation range forms.
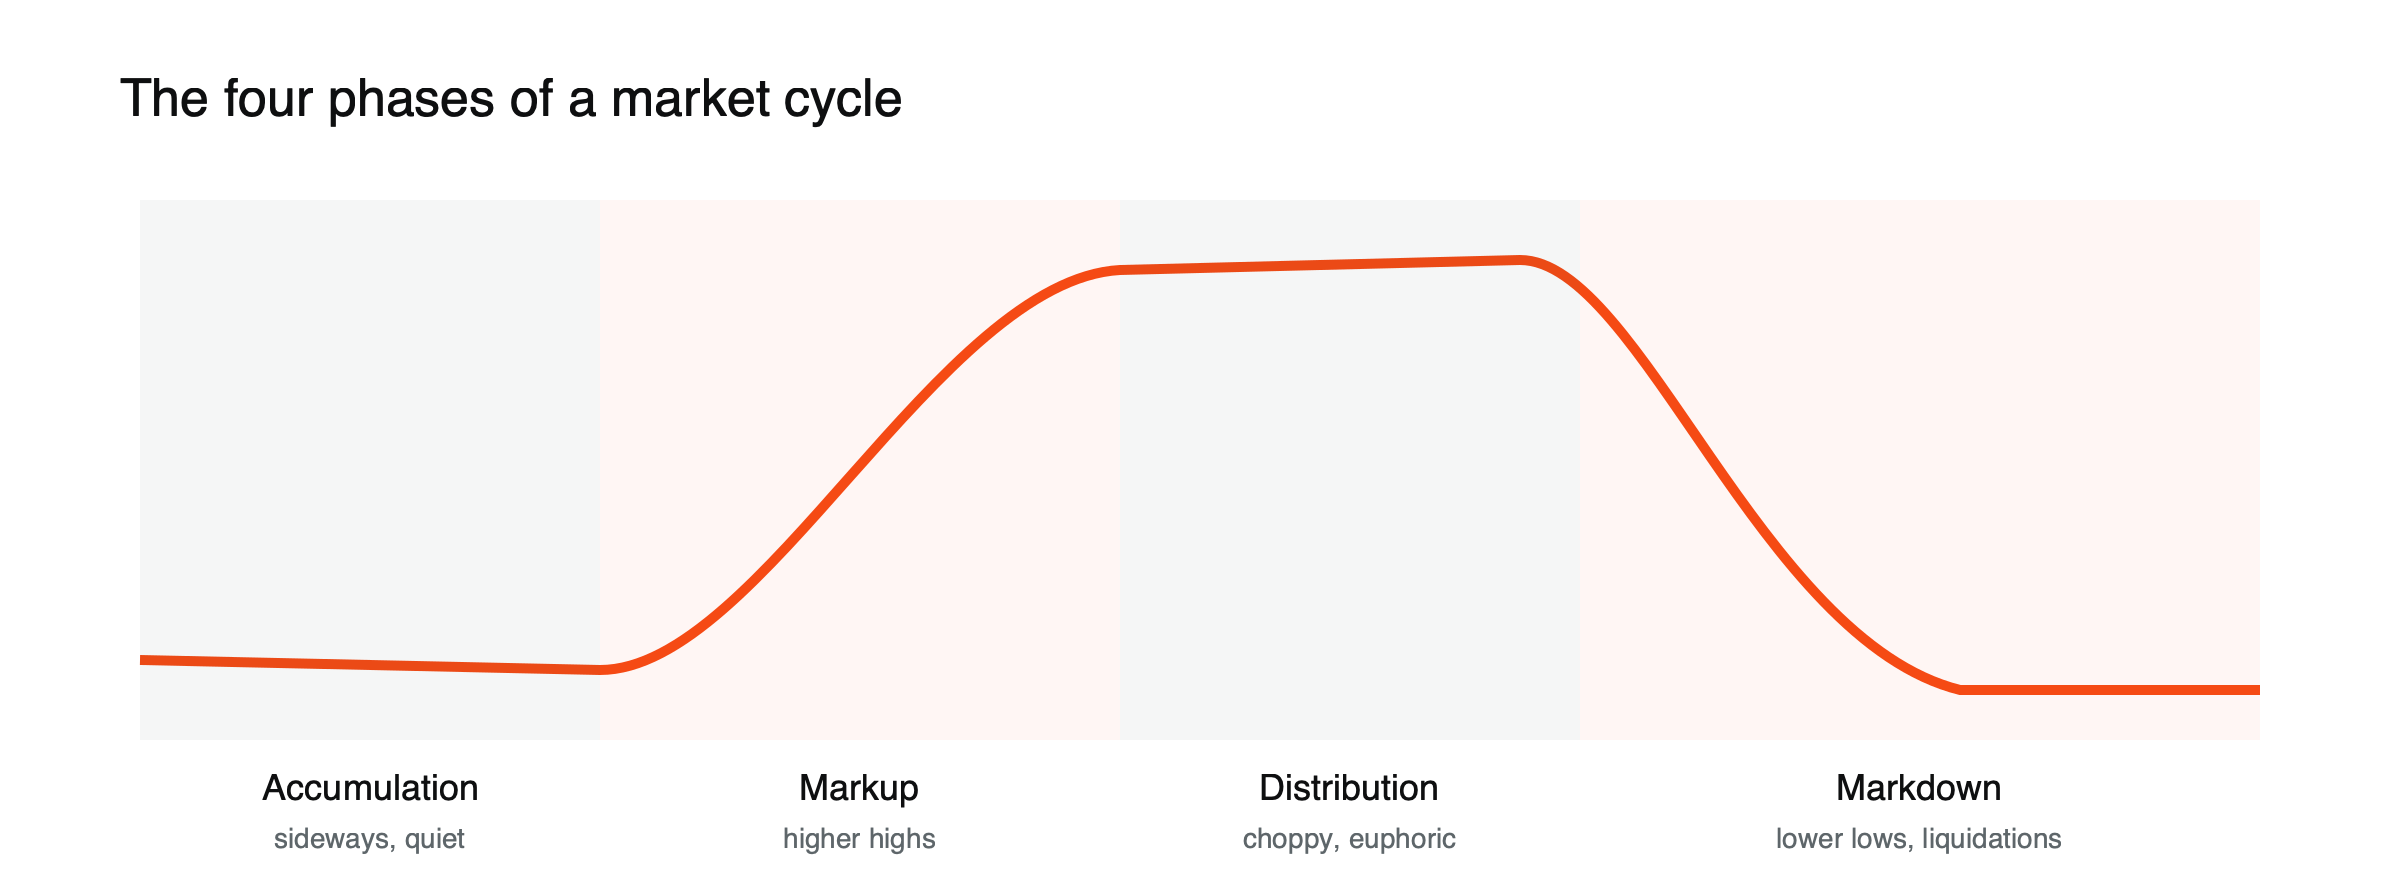
Figure: The four-phase cycle in stylized form. Real cycles vary in length and depth.
What drives the cycle
- Liquidity and interest rates. Easy money and falling rates tend to push investors toward riskier assets such as crypto; tighter money pulls them back.
- Leverage. Borrowed money amplifies the move up and then the move down, as liquidations force selling at the worst moment. See how liquidation cascades work.
- Supply events. Bitcoin’s halvings cut the flow of new coins on a fixed schedule; token unlocks add supply for specific projects.
- New stories. DeFi, NFTs, meme coins and tokenized assets have each drawn new money into the market for a time.
- Human behavior. Fear of missing out near the top and capitulation near the bottom repeat in every cycle.
The most recent cycle, phase by phase
The years 2024 to 2026 showed several phases in quick succession. US spot bitcoin ETFs began trading on January 11, 2024, opening a new channel for institutional money. Bitcoin’s fourth halving followed in April 2024, cutting new supply. Prices then climbed through 2025 to a high of about $126,000 in October.
The late stage had classic distribution features. Launch platforms made token creation almost free, and the number of projects tracked by CoinGecko’s GeckoTerminal rose to about 20.2 million by the end of 2025. After the market sold off in October 2025, 7.7 million tokens stopped trading in the fourth quarter alone, the highest quarterly total CoinGecko had recorded, and bitcoin fell roughly 47% to near $60,000 by early 2026. Easy issuance near the top followed by mass failure on the way down is a textbook distribution-to-markdown sequence.
How each phase tends to feel
| Phase | What the chart shows | What the crowd says |
|---|---|---|
| Accumulation | A long, narrow sideways range | “Crypto is dead” or silence |
| Markup | A breakout and rising highs | “This time it’s different” |
| Distribution | Choppy swings near the top | “It can only go up” |
| Markdown | Falling highs and liquidation spikes | “Get out at any price” |
How money moves through the market
Within a cycle, money rarely spreads evenly. In markup it usually arrives first in bitcoin, then in the largest altcoins such as ether, and only later in smaller and more speculative coins. That late rush into small caps, sometimes called altcoin season, is often a sign that the cycle is maturing rather than starting. See what altcoin season is.
In markdown the order reverses. The smallest coins lose liquidity first and fall furthest, investors retreat toward bitcoin and stablecoins, and bitcoin’s share of total crypto market value tends to rise. Watching which part of the market is leading, and which is lagging, gives a rough sense of where a cycle stands without relying on any single price level.
Signals people use to place the cycle
No single indicator says which phase a market is in, but several are widely watched together:
- Funding rates on perpetual futures, which turn persistently positive when leverage builds in markup and distribution.
- Stablecoin supply, which tends to grow when new money is arriving and shrink when it leaves.
- Bitcoin’s share of total crypto market value, which usually rises in markdown and falls in late markup.
- New token launches and search interest, which surge near tops and fade in accumulation.
Read together, they describe conditions rather than predict turns. A market can show late-cycle signals for many months before the trend actually changes, and early-cycle signals can appear during a pause that turns out to be only a pause. Treat them as context for risk decisions, not as a timer or a trading signal on their own. See what the funding rate is.
Bitcoin’s four-year pattern
Bitcoin’s history has often been described as a four-year cycle tied to its halvings, with each halving followed by a rally and then a deep decline. That is one version of the market cycle, not the definition of it. Only four halvings have happened, and the size of each rally has shrunk. See why Bitcoin’s four-year cycle is so debated.
Using cycles without being fooled by them
Cycles help explain where a market has been. They are much weaker as a timing tool, because phases can last months longer than expected, skip ahead or reverse. Treating a cycle model as a forecast is how traders end up selling too early or buying a “dip” that keeps falling.
A more useful approach is to ask which phase current conditions most resemble, and whether your position size and leverage would survive if that guess is wrong. A portfolio built for markup can be badly exposed in distribution, even if the label only becomes clear months later.
For how the up and down phases are defined, read what a bull market and a bear market are in crypto. For why so many tokens disappear in markdown, see why most cryptocurrencies fail, and for the basics, what cryptocurrency is.
This article is educational content and does not constitute financial, investment, legal or tax advice. Digital assets are volatile and you may lose the amount you invest.
Sources
- CoinGecko Reports Record Token ‘Mortality’ in 2025 (7.7 million failures in Q4 2025 after the October crash) — ForkLog, January 2026
- Over Half of All Crypto Tokens Are Now Dead: CoinGecko Report (20.2 million projects by 2025; launchpad-driven growth) — CryptoPotato via KuCoin, January 2026
- IBIT: the ETF that made bitcoin a blue chip (US spot bitcoin ETFs began trading January 11, 2024) — BIT Knowledge Hub
- Bitcoin halving is sealed after mining of block 840,000 (April 2024) — Finance Magnates
- Bitcoin down 47% from $126,000 peak (October 2025 high; early 2026 low near $60,000) — Analytics Insight, February 2026