
How to Read Trading Volume in Crypto
Trading volume shows how much of a crypto asset changed hands. How to read it, how it differs from liquidity, and how to spot fake volume before you rely on it.
To read crypto trading volume, compare today’s volume with its recent average, check where it happens, read it alongside price and confirm it with order book depth. Volume shows how active a market is, but it can be inflated: a 2019 Bitwise study found about 95% of reported bitcoin spot volume was fake or non-economic.
What volume measures
Trading volume is the total value of an asset bought and sold over a period, usually 24 hours. Every trade has a buyer and a seller, so volume counts each trade once. It is different from liquidity, which is how much you can trade without moving the price. See what liquidity is in crypto.
Five checks
Compare with the asset’s own average
A day with three times the usual volume means something; a large number on its own does not. Look at volume over the past weeks before judging today’s.
Check where the volume happens
Data sites list volume by exchange and pair. Volume concentrated on one little-known venue is less reliable than volume spread across several large, regulated exchanges.
Read it alongside price
- Price rising on rising volume: many participants are behind the move.
- Price rising on falling volume: fewer buyers are pushing it higher.
- Sharp drop on very high volume: often forced selling or liquidations.
Confirm with order book depth
Check how much is offered within 1% or 2% of the current price. Real activity usually comes with real depth. See what an order book is.
Separate spot from derivatives
Futures and perpetual volume is often much larger than spot volume and reflects leveraged trading, not purchases of the asset itself.
Relative volume in numbers
Suppose an asset usually trades about 20,000 BTC worth a day, averaged over the past month, and today it trades 60,000. (Illustrative figures.) Its relative volume is 3: three times normal. A move on relative volume above about 2 has many more participants behind it than one on relative volume below 1, which is why traders compare volume with the asset’s own history rather than with other assets.
Volume at breakouts
Volume helps judge whether a break through support or resistance is likely to hold. A breakout on strong relative volume suggests real participation; one on low volume is more likely to fail and fall back inside the old range. See what support and resistance are.
Spot and derivatives side by side
Comparing spot volume with derivatives volume shows what is driving a move. A rally led by spot buying, with steady derivatives activity, tends to be sturdier than one powered mostly by leveraged futures, which can unwind quickly. When derivatives volume dwarfs spot volume and funding rates are high, leverage is doing much of the work. See what perpetual futures are.
Volume on decentralized exchanges
Decentralized exchange volume is recorded on-chain, which makes it verifiable, but not always meaningful. Trading bots, arbitrage between pools and incentive programs that reward trading can all inflate numbers without reflecting real demand. Looking at the number of distinct traders and the size of the pools alongside volume gives a more honest picture.
Volume is not liquidity
A market can show large volume and still be hard to trade in size. Volume counts what traded over a period; liquidity describes how much you could buy or sell right now without moving the price. A token pumped by a burst of trading may show huge volume for a day while its order book stays thin. Before placing a large order, the depth near the current price matters more than yesterday’s volume. See what liquidity is in crypto.
Patterns through the day and week
Crypto trades around the clock, but activity follows the working hours of the main financial centers. Volume often rises when European and US markets are open and thins out late at night in those regions and at weekends. Comparing a weekend’s volume with the weekday average can make a normal weekend look alarmingly quiet, so like-for-like comparisons, same hour or same day of week, give a fairer read.
A short routine before trading
Check relative volume against the past month, see which venues the volume comes from, compare spot with derivatives activity and look at order book depth for your size. Together these take a few minutes and filter out many misleading signals.
What the 2019 study found
The clearest evidence of fake volume came in a 2019 report that Bitwise submitted to the US Securities and Exchange Commission. Of 81 exchanges it examined, 71 showed signs of fake or non-economic trading. Across the market it estimated that bitcoin’s reported daily spot volume of about $6 billion included only around $270 million of real trading, concentrated on a small group of exchanges. Incentives explained much of the problem: higher reported volume helped exchanges climb rankings and attract token projects willing to pay for listings. Since then, data providers have added filters, rankings that weigh order book depth and transparency, and lists of exchanges they consider reliable, but the lesson stands: headline volume should be checked against depth and reputation. Checking a few exchanges’ order books yourself remains the simplest way to see whether reported activity is real or merely manufactured.
How to spot fake volume
Wash trading means trading with yourself to inflate activity. In its 2019 report to the US Securities and Exchange Commission, Bitwise examined 81 exchanges and found that 71 showed signs of fake or non-economic volume: about $6 billion of reported daily bitcoin volume, of which roughly $273 million was real. Exchanges had an incentive, since high volume attracts token listings and fees. Warning signs include:
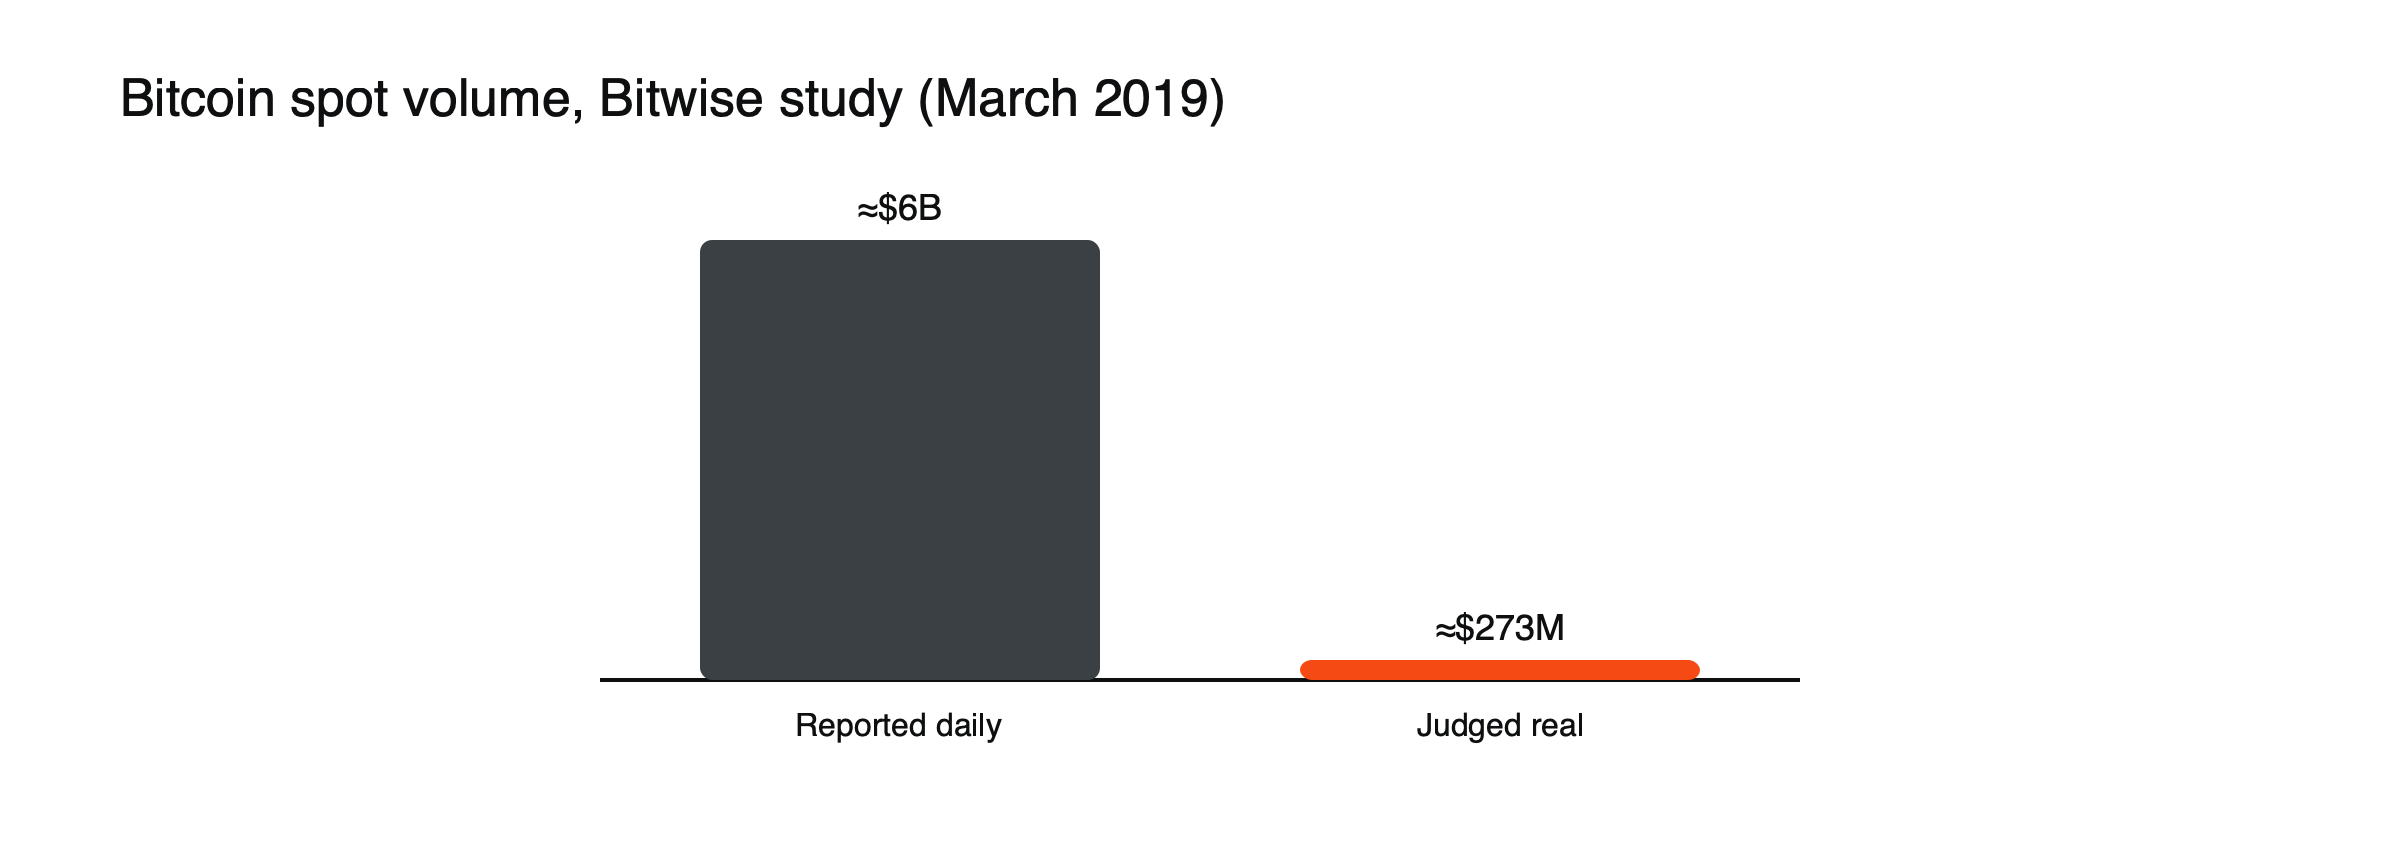
Figure: Reported vs real bitcoin spot volume in the 2019 Bitwise study.
- Very high volume with a thin order book.
- Trades of identical size at regular intervals.
- Volume far out of line with the exchange’s size or web traffic.
What volume cannot tell you
Volume shows activity, not direction. It does not predict where price goes next. For how volume fits with chart reading, see how to read candlestick charts, and for the basics, what a cryptocurrency exchange is.
This article is educational content and does not constitute financial, investment, legal or tax advice. Digital assets are volatile and you may lose the amount you invest.
Frequently asked questions
Why do volume figures differ between data sites?
Sites track different exchanges and pairs, apply different filters to remove suspicious volume and may or may not include derivatives. Comparing the same source over time is more reliable than comparing sources.
Is high volume always good?
No. Very high volume can accompany panic selling or liquidations as easily as healthy buying. Volume tells you how much activity there was, not whether it was good news.
Sources
- 95% of Spot Bitcoin Trading Volume Is Fake: Report (81 exchanges, 71 with fake or wash trading; ~$6 billion reported vs ~$270 million real; listing incentives) — ThinkAdvisor via SEC filing, March 2019
- Nearly all Bitcoin trades are fake, apparently ($273 million real) — MIT Technology Review, March 2019
- How to spot fake volume on cryptocurrency exchanges (identical trades; zero-volume periods) — CoinJar