
What Is the Crypto Fear and Greed Index?
The Crypto Fear and Greed Index scores sentiment from 0 to 100 using volatility, volume, social media, dominance and search trends. How it works and its limits.
The Crypto Fear and Greed Index is a daily sentiment score published by Alternative.me that rates the crypto market from 0, extreme fear, to 100, extreme greed. It combines bitcoin volatility, trading momentum and volume, social media activity, bitcoin dominance and Google search trends. Traders often read it as a contrarian signal, but it describes mood, not value.
Where the idea came from
Alternative.me adapted the idea from CNN’s Fear and Greed Index for US stocks, which combines several market indicators into a single sentiment score. The crypto version swaps stock-market inputs for measures that suit a market trading around the clock, such as social media activity and search interest. Both rest on the same observation: markets tend to overshoot when emotions run high in either direction.
What goes into the score
| Component | Weight |
|---|---|
| Volatility (compared with 30- and 90-day averages) | 25% |
| Market momentum and volume | 25% |
| Social media activity and sentiment | 15% |
| Surveys (currently paused) | 15% |
| Bitcoin dominance | 10% |
| Google Trends for bitcoin searches | 10% |
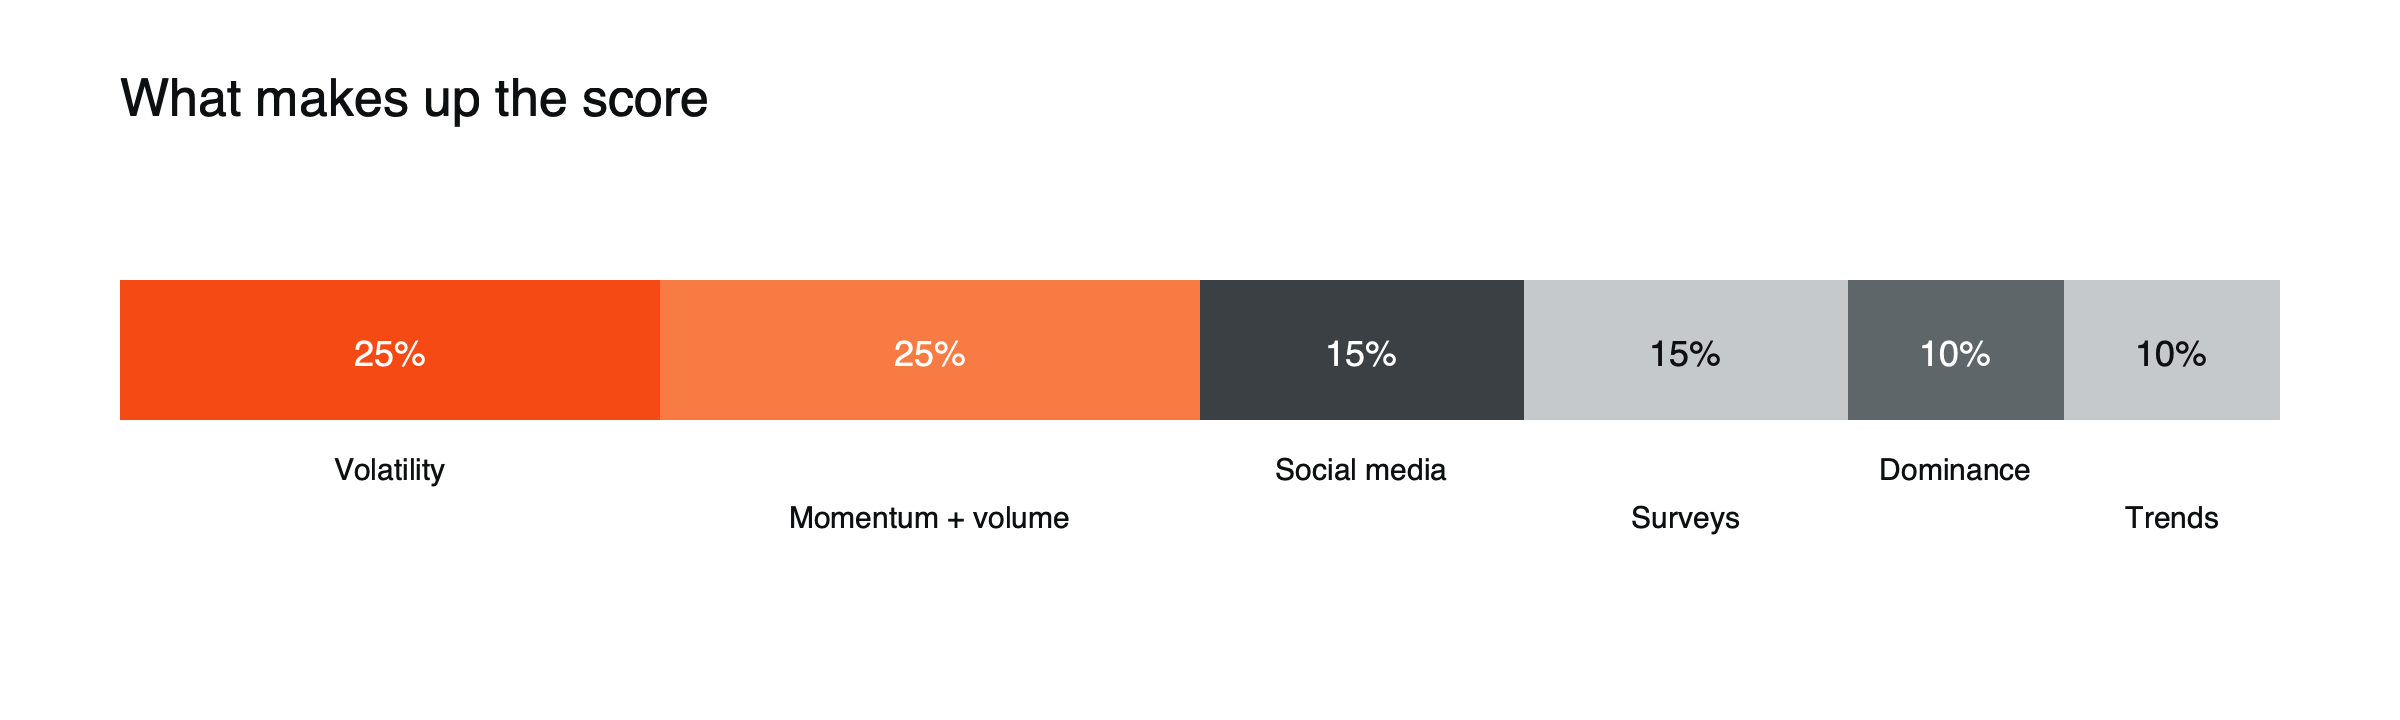
Figure: How the Crypto Fear and Greed Index is weighted.
High volatility and heavy selling push the score toward fear; strong buying, rising social activity and search interest push it toward greed. Bitcoin dominance is bitcoin’s share of total crypto market value.
How to read the scale
- 0–24: extreme fear
- 25–49: fear
- 50–74: greed
- 75–100: extreme greed
A score, read in context
Suppose bitcoin has fallen 30% in three weeks and the index reads 15, extreme fear. (Illustrative scenario.) The reading confirms what the chart already shows: volatility is high, momentum is negative and search interest has dropped. On its own, it says nothing about whether the fall is nearly over. Read in context, though, it can prompt useful questions: is leverage being flushed out, are long-term holders selling or buying, and is the selling broad or concentrated in a few assets? The index works best as a starting point for those questions rather than as an answer.
How traders use it
The common reading is contrarian: extreme fear may mean selling is overdone, extreme greed that buyers are stretched. It can also act as a check on your own emotions. If you feel urgent to buy when the index reads extreme greed, that is worth noticing.
A check on your own emotions
One of the most practical uses of the index is personal. When it reads extreme greed and you feel a strong urge to buy before the price runs away, the urge itself is the warning sign, because that is when many others feel it too. When it reads extreme fear and you feel desperate to sell everything, the same applies in reverse. Pausing before acting on a strong emotion, and checking whether the decision fits a plan you made earlier, is often worth more than any signal the index provides.
Pairing it with other measures
Sentiment scores become more useful alongside measures of positioning. Extreme greed with very high funding rates and rising open interest describes a market crowded with leveraged longs. Extreme fear with negative funding and falling open interest describes one where leverage has already been cleared. Bitcoin dominance adds context about whether money is fleeing to the largest asset or rotating into smaller ones. See what a funding rate is and what open interest is.
Other ways to measure sentiment
The index is one of several approaches. Options markets offer their own read through the relative price of puts and calls. Social analytics firms track the tone and volume of posts about specific coins. Flows into and out of exchange-traded funds show how institutional investors are positioning. Each captures a different slice of the market’s mood, and they do not always agree.
How not to use it
The index is easy to misuse. Treating every extreme reading as a signal to trade against the crowd ignores how long extremes can last; buying at every reading of extreme fear in a long bear market would have meant buying all the way down. Using it on altcoins assumes they share bitcoin’s mood, which is often untrue. And checking it constantly can feed the very emotions it measures. Used occasionally, alongside a plan, it adds perspective; used as a trading system, it usually disappoints.
The index across market cycles
Over past cycles, readings of extreme greed have tended to cluster near the later stages of major rallies, when prices had risen far and fast, while long stretches of fear have accompanied bear markets and their recoveries. The pattern is clearest in hindsight. At the time, it is hard to tell whether a week of extreme greed is the top or a pause in a rally that runs much further. See what a crypto market cycle is.
Reading the components separately
The single score hides useful detail. The volatility component shows whether price swings are larger than usual, which tends to accompany fear. The momentum and volume component shows whether buying or selling is dominant. Social media activity reflects how much attention crypto is getting, which often peaks near greed. Bitcoin dominance rising is read as fear, since money is retreating to the largest asset. Search trends show whether the wider public is paying attention. When the components disagree, for example high social activity with weak momentum, the overall score may sit near the middle while the market is anything but calm. Looking past the headline number to the parts that drive it gives a more honest view of what kind of mood the market is in. Some traders track the components on their own charts, which turns a single daily number into a small but useful dashboard of the market’s mood and its shifts over time.
Limits
- Mostly bitcoin. Nearly every input uses bitcoin data, so it may not reflect altcoins.
- Partly opaque. The weights are published, but the detailed calculations cannot be independently checked.
- Not a timing tool. Markets can stay in extreme fear or greed for weeks.
- Can be influenced: social media and volume can be moved by large players.
Sentiment is one input alongside price structure and risk management. See what a crypto market cycle is and crypto bull and bear markets. For the basics, read what spot trading is.
This article is educational content and does not constitute financial, investment, legal or tax advice. Digital assets are volatile and you may lose the amount you invest.
Frequently asked questions
Does extreme fear mean it is a good time to buy?
Not necessarily. Extreme fear has sometimes coincided with market lows, but it has also lasted through long declines. It describes the mood, not the bottom.
How often is the index updated?
It is published daily. Because its inputs move during the day, the reading can lag sudden moves, especially in fast markets.