
Inflation Surprise vs Inflation Trend: Which Moves Markets More?
On release day, the surprise versus forecasts moves prices; over months, the trend drives central banks and markets. How to read inflation data both ways.
In the inflation surprise vs trend debate, both matter on different time scales. On release day, the surprise against forecasts moves prices: a hotter-than-expected US CPI report in September 2022 sent bitcoin down about 10% and stocks sharply lower. Over months, the trend decides what central banks do, and that sets the direction for bonds, currencies and stocks.
Side by side
| Surprise | Trend | |
|---|---|---|
| What it is | Actual minus forecast | Direction over several months |
| Time scale | Minutes to days | Months to years |
| Main channel | Repricing of the next few rate decisions | The central bank’s whole policy path |
| Example | September 2022 CPI: bitcoin −10% on the day | 2022: rising inflation kept rates rising all year |
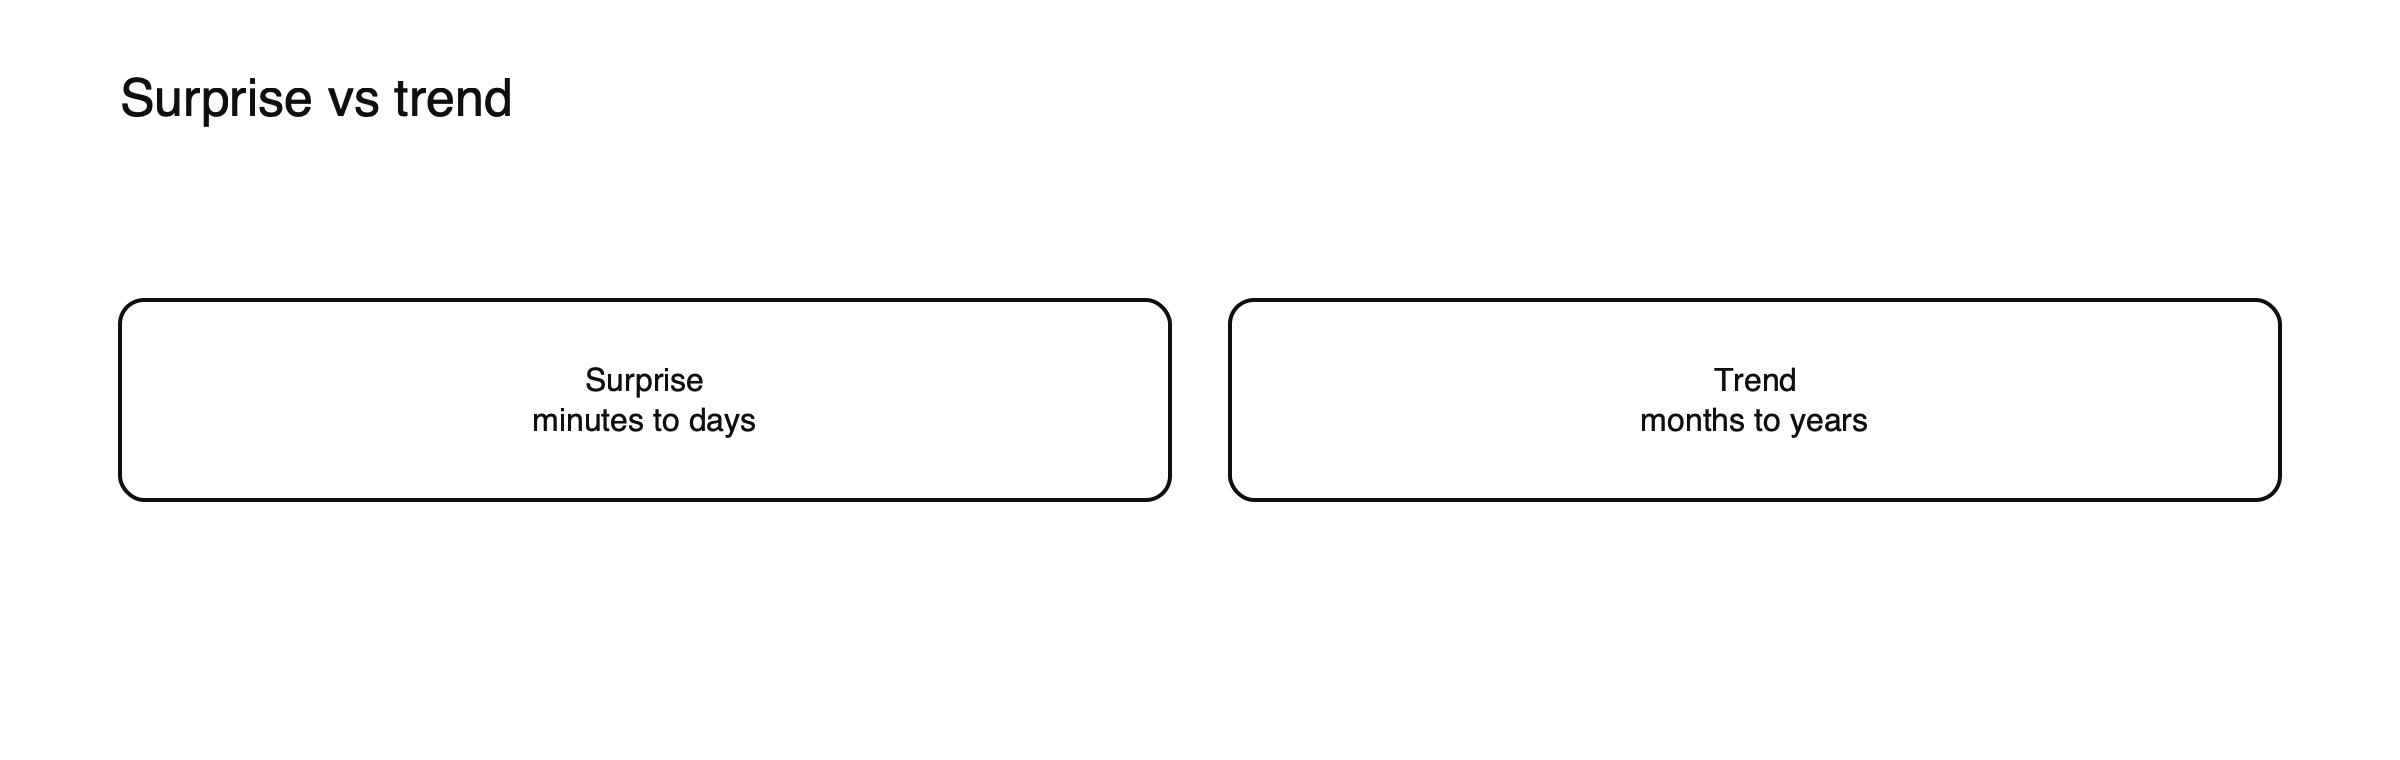
Figure: Surprise and trend work on different time scales.
A surprise, illustrated
Suppose economists expect monthly core inflation of 0.3% and the release shows 0.4%. (Illustrative scenario.) The surprise is 0.1 point, small in isolation, but at an annual rate it suggests inflation running more than 1 point faster than expected. Traders raise their expectations for rates, the 2-year Treasury yield jumps, the dollar strengthens and shares fall within minutes. A reading of 0.2% would trigger roughly the opposite move. The market prices the gap, not the number.
Why surprises move markets fast
Prices already reflect the forecast. A surprise forces traders to update expected interest rates immediately. In 2026, one study found bitcoin’s one-hour move after CPI releases was strongly linked to the size of the surprise. See why crypto has started reacting to US economic data.
Why the trend matters more over time
Central banks look through single readings and focus on persistent inflation, especially core measures excluding food and energy. A string of soft reports can change the policy path even if each was only slightly below forecast.
Trend measures, illustrated
Suppose four monthly core readings are 0.4%, 0.3%, 0.2% and 0.2%. (Illustrative figures.) The three-month annualized rate, using the last three readings, is about 2.8%, while the latest month annualized is about 2.4%. The year-over-year rate, covering twelve months, may still be higher, say 3.5%, because it includes older, hotter readings. Central banks look at all three to judge whether inflation is truly slowing, and markets watch the shorter measures for early signs of a turn.
Headline and core
Headline inflation includes food and energy, which swing with commodity prices; core excludes them and is a better guide to underlying trends. Markets often react to core surprises more than headline ones, because central banks focus on core. In energy shocks, headline can jump while core stays steady, and markets usually look through the headline move. See how energy shocks travel through inflation, rates and currencies.
Where the usual answer flips
A single big surprise can matter more than the trend when it changes the central bank’s narrative, as the first readings that confirm a turn often do. Watch the details, such as services and core components, not just the headline.
For the policy side, see what markets listen for in a central bank meeting and what 1970s inflation teaches today’s markets.
Services and goods
Inflation is often split into goods and services. Goods prices respond quickly to supply chains and commodity prices; services prices, especially housing and wages, move more slowly and persistently. Central banks watch services inflation closely, because once it rises, it tends to stay high. A surprise in services inflation can therefore move markets more than one in goods.
2022 as a case study
In 2022, a series of upside surprises, including the September release that sent bitcoin down about 10% in a day, kept pushing expectations for Fed rates higher. The trend was rising all year, and each surprise confirmed it. Once inflation began to fall in late 2022 and 2023, downside surprises lifted markets, as each one suggested the peak in rates was near. See what 2022 taught investors about diversification.
Trading inflation releases
Many traders reduce position size before major inflation releases, avoid tight stops and wait for the initial reaction to settle. Comparing the surprise in core, services and headline figures, rather than reacting to one number, gives a fuller picture. See how to read an economic calendar.
Base effects
Year-over-year inflation compares prices with twelve months earlier, so the reading depends on what happened a year ago. If prices jumped a year ago, the annual rate can fall sharply even if monthly inflation stays steady, a so-called base effect. Markets usually anticipate base effects, so the surprise relative to forecasts matters more than the headline drop.
Inflation expectations
Beyond actual readings, markets watch inflation expectations from surveys and from bond markets. If expectations stay anchored near the central bank’s target, a single hot reading may have limited impact. If expectations start rising, central banks tend to react more forcefully, and each surprise matters more. See how to read breakeven inflation.
Inflation and gold
Gold often reacts to inflation releases through real yields: a hot reading that raises expected rates can lift real yields and weigh on gold, while a soft one can do the reverse. Over longer periods, persistent inflation has often supported gold as a store of value.
Inflation in other countries
Euro-area, UK and Japanese inflation releases move their own currencies and bonds in the same way, through expectations for each central bank. Comparing surprises across countries helps explain currency moves.
Common misreadings
- Reacting to the headline without checking core.
- Treating one month as a trend.
A release-day checklist
- What is the consensus for headline and core?
- Are base effects expected to move the annual rate?
- What are services and housing components doing?
How the consensus is formed
The forecast that markets measure surprises against is usually the median of economists’ estimates, collected in the days before the release. Some traders also watch less formal expectations, built from earlier data such as producer prices and import prices. If those earlier data point higher, the market may effectively expect a hotter reading than the official consensus, and a reading that matches the consensus can then feel like a downside surprise.
When surprises stop mattering
In some periods, inflation releases barely move markets, because the central bank has signaled a fixed path or because other concerns, such as growth or geopolitics, dominate. Recognizing these phases helps traders avoid expecting large moves every month. In 2026, research found bitcoin’s sensitivity to inflation surprises had risen again, showing how the importance of a release changes with the central bank’s focus.
Inflation and share sectors
Hot inflation readings tend to hurt rate-sensitive sectors, such as technology, property and utilities, while banks and commodity producers may hold up better. Soft readings often lift the sectors hit hardest by higher rates. Watching sector moves on release day shows how markets are translating the surprise into expected rates.
The role of wages
Wage growth is a key driver of services inflation, because labor is the largest cost for most service businesses. Central banks therefore watch wages alongside inflation releases. If wages are rising much faster than productivity, inflation is likely to stay high even if goods prices fall, and markets treat soft inflation readings with more caution. See why payroll data can move bonds before stocks.
Inflation and currencies
A hotter US inflation reading usually lifts the dollar, as markets price higher rates for longer, while a softer one weakens it. The reaction is often largest against currencies whose central banks are expected to move differently, such as the yen. Currency traders compare the surprise with expectations for other central banks to judge whether the move is likely to last. Moves that still hold through the next trading session are usually the more meaningful ones for traders.
Frequently asked questions
Why can markets rise on high inflation?
If the reading is lower than expected, or if details such as core and services are softer, markets can rally despite high inflation.
Which inflation measure does the Fed target?
The Fed’s target uses a different index from the consumer price index, but markets react most to the consumer price index because it is released first.
This article is educational content and does not constitute financial, investment, legal or tax advice. Digital assets are volatile and you may lose the amount you invest.
Sources
- Big macro week: FOMC minutes, PPI and CPI (bitcoin −10% on the prior CPI release day, in step with stocks) — K33 Research, October 2022
- Is Bitcoin showing greater sensitivity to US CPI releases again? (surprise defined as actual minus median expectation; one-hour R² near 80%) — Block Scholes, 2026
- Market bracing for 8.8% CPI release (CPI days among the most volatile in 2022) — K33 Research, July 2022