
What Happens to Stocks After a 10% Correction?
Since 1950 the S&P 500 has had about 36 to 38 corrections of 10% or more. How long they last, how often they become bear markets and what history suggests.
A stock market correction is a fall of 10% or more from a recent high. Since 1950, the S&P 500 has had roughly 36 to 38, about one every two years. Most ended within months and recovered in three to eight months, but a minority deepened into bear markets of 20% or more that took years to recover.
How often corrections happen
Counts vary by method, but Yardeni Research listed 36 corrections of at least 10% from 1950 to 2018, and a later count found about 38 corrections and 14 bear markets since 1950. Corrections are a normal feature of stock markets, not a rare event.
How long they last
- Most are short: 22 of the 36 corrections in the Yardeni count, about 61%, ended within four months.
- Average length: about 196 calendar days from peak to trough across the period; corrections from 1987 onward averaged closer to 168 days.
- Typical recovery: about three to eight months back to the previous high.
When they become bear markets
In the Yardeni count, seven corrections lasted a year or more, and five of those became bear markets. The deepest post-1950 bear markets, such as 1973–74, 2000–02 and 2008–09, took years to recover; the 1973–74 decline needed about 90 months. There is no reliable way to know in advance which correction will deepen.
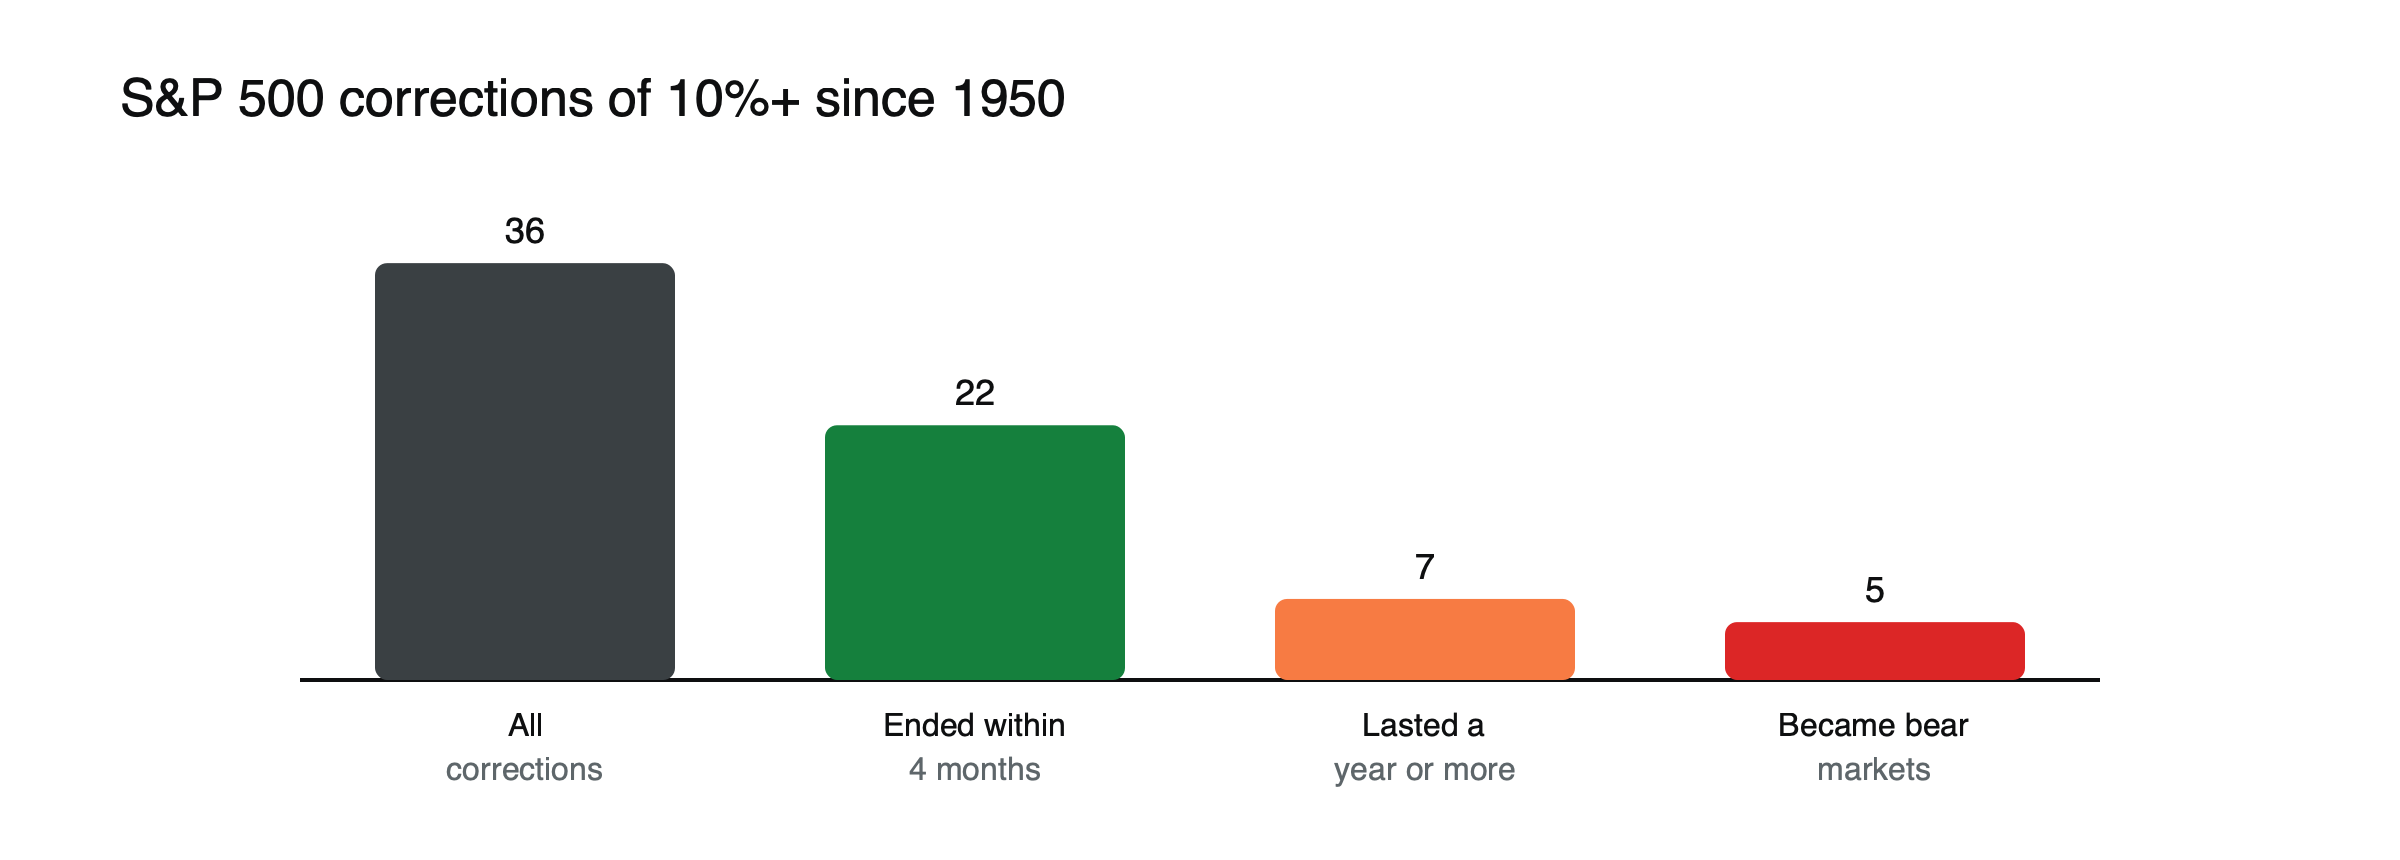
Figure: Most corrections end quickly; a few become bear markets. Source: Yardeni Research via Nasdaq, 2018.
Why corrections happen
Common triggers include rising interest rates, earnings disappointments, valuation pressure and shocks such as wars or pandemics. Corrections without a recession have usually been shallower and shorter.
Recent corrections
Corrections and bear markets have continued to arrive regularly. In the final quarter of 2018, the S&P 500 fell close to 20% as investors worried about rising interest rates and trade tensions, before recovering the following year. In 2020, the pandemic produced a fall of about 34% in 23 trading days, followed by a rapid rebound. In 2022, rising inflation and interest rates pushed the index into a bear market. In April 2025, tariff announcements drove a fall of about 19% from the year’s high, before the index recovered to finish the year higher.
A correction, illustrated
Suppose an investor holds $20,000 in an index fund and a trader holds $20,000 of index CFD exposure on $5,000 of margin. (Illustrative figures.) A 10% correction costs the investor $2,000, 10% of the money invested, a loss that can be waited out. The trader also loses $2,000, which is 40% of the margin and may trigger a margin call or stop-out, crystallizing the loss before any recovery. The same correction is a routine event for one and a serious threat for the other. See what margin calls and stop-outs are.
Recovery times
Recoveries have varied enormously. Most post-1950 corrections recovered in roughly three to eight months, but the deepest bear markets took years: the decline of 1973–74 needed about 90 months to recover fully. Recoveries after corrections without a recession have generally been much faster than recoveries from bear markets tied to economic downturns or financial crises.
Buying during corrections
Some investors add to positions during corrections, on the basis that most have recovered within months. The approach has worked over long periods for diversified index investors with time to wait, but it is painful when a correction turns into a bear market, and it depends on having cash available and the patience to hold. For leveraged traders, buying into a falling market without a stop can turn a correction into a much larger loss.
Signs a correction may deepen
Corrections have more often become bear markets when they were accompanied by a recession, sharply rising unemployment, widening credit spreads, falling earnings forecasts or a financial crisis. Corrections driven mainly by valuation worries or a temporary shock, with the economy still growing, have more often stayed shallow. Watching these signals does not predict the outcome, but it helps judge the risk. See what happens to stocks in a recession.
Volatility during corrections
Volatility usually rises during corrections, with larger daily moves in both directions and sharp rallies along the way. The VIX tends to jump as prices fall. Larger daily swings mean positions sized for calm markets carry more risk, which is why many traders reduce size as volatility increases. See what the VIX is.
What history suggests
Every post-1950 correction in the S&P 500 eventually recovered, but timelines ranged from weeks to years, and past patterns do not guarantee future results. Investors who need money soon face very different risks from those with long horizons. See how bear markets end and what happens to stocks in a recession.
Crypto comparison
Crypto markets experience 10% moves far more often; a 10% fall in bitcoin can happen within days, and falls of 50% or more from a peak have occurred several times. A 10% decline that would count as a correction in shares is an ordinary week in crypto. Comparing the two shows why position sizes for crypto need to be far smaller than for stock indices. See what crypto volatility is.
Corrections in other indices
Corrections in the Nasdaq 100 and the Russell 2000 have tended to be deeper than in the S&P 500, because technology and smaller companies are more sensitive to interest rates and risk appetite. A 10% correction in the S&P 500 can coincide with a 15% or larger fall in more volatile indices. Traders holding several indices should expect the most volatile ones to move furthest. See Russell 2000 vs S&P 500.
Corrections and bear markets compared
| Correction | Bear market | |
|---|---|---|
| Size | 10% to 20% from a high | 20% or more |
| Frequency since 1950 | About 36 to 38 | About 14 |
| Typical cause | Valuations, rates, temporary shocks | Recessions, financial crises |
| Typical recovery | Months | Often years |
How sectors behave
During corrections, the sectors that led the previous rally often fall the most, while defensive sectors such as utilities, consumer staples and healthcare tend to fall less. That pattern is not guaranteed: in a liquidity panic, investors sell almost everything. When a correction ends, the leaders of the next rally are sometimes different from those of the last one. See why defensive stocks tend to hold up late in the cycle.
The psychology of corrections
Corrections are uncomfortable because they arrive suddenly after periods of calm and often come with alarming headlines. Many investors sell near the bottom out of fear and then hesitate to buy back as prices recover. Deciding in advance how you will respond to a 10% fall, and sizing positions so that you can follow that plan, reduces the chance of making decisions in a panic.
A correction checklist
- How much would a further 10% fall cost your account?
- Is there a recession or credit stress behind the decline?
- Are your positions sized for current volatility?
- Do you have a plan for adding, holding or cutting exposure?
What a 10% fall means in points
Index levels make corrections sound larger than they are. With the S&P 500 near 6,800, a 10% correction is about 680 points; with the Dow near 48,000, about 4,800 points. Headlines about record point falls often describe moves that, in percentage terms, are not unusual. Converting points into percentages, and then into the money at stake in your own positions, gives a clearer picture.
Dividends during corrections
For long-term investors, dividends continue to be paid during most corrections, and reinvesting them at lower prices can speed up the recovery of total returns. Companies under severe pressure can cut dividends, especially in recessions, so the cushion is not guaranteed.
Rebalancing after a correction
Investors who hold a fixed mix of shares, bonds and cash often rebalance after a correction, selling assets that held up better and buying shares that have fallen, which brings the mix back to its target. The discipline forces buying at lower prices without needing to predict the bottom, though it can mean buying into a decline that continues.
Corrections and the economy
Share prices often fall before the economy weakens, because markets look ahead. A correction can therefore be an early sign of a slowdown, or simply a reaction to valuations that ran too far. Economic data, earnings revisions and credit markets in the following months usually reveal which it was. Corrections that occur while employment and profits are still growing have tended to be shorter, while those that come with rising unemployment have more often deepened into bear markets. Context matters as much as size.
Common misreadings
- Treating every correction as the start of a crash.
- Assuming every correction will recover quickly.
- Applying long-term recovery statistics to leveraged positions.
Frequently asked questions
How often do corrections happen?
Since 1950, the S&P 500 has had roughly 36 to 38 corrections of 10% or more, about one every two years on average.
How long do corrections usually last?
About 61% of the corrections in one long-run count ended within four months, but some lasted a year or more and became bear markets.
Is a correction a good time to buy?
Historically, many corrections have been followed by recoveries, but there is no way to know in advance which ones will deepen, so position size and time horizon matter.
This article is educational content and does not constitute financial, investment, legal or tax advice. Digital assets are volatile and you may lose the amount you invest.
Sources
- How Long Do Stock Market Corrections Last? (Yardeni: 36 corrections since 1950; 61% within four months; 196-day average; seven extended, five became bear markets; 168 days since 1987) — Nasdaq / Motley Fool, 2018
- Every major stock market correction since 1950 (about 38 corrections and 14 bear markets; three to eight months typical recovery; 90-month recovery after 1973–74) — Stacker via KEYT, August 2026
- 2025 index returns and drawdowns (S&P 500 max drawdown −19%) — Charles Schwab, December 2025
- COVID-19 market crash 2020 (S&P 500 −34% in 23 trading days) — Fin Still