
How the Euro’s Launch Changed Currency Markets
The euro launched on January 1, 1999, replacing 11 currencies. It opened above $1.18, fell to $0.82 by October 2000 and became the second reserve currency.
The euro launched on January 1, 1999, replacing the national currencies of 11 countries for financial transactions, with notes and coins following on January 1, 2002. It created EUR/USD, now the world’s most traded currency pair, and a second major reserve currency. The euro opened above $1.18 but fell to a record low near $0.82 in October 2000 before recovering.
Why Europe built a single currency
The euro grew out of decades of efforts to stabilize exchange rates between European countries, including the Exchange Rate Mechanism that sterling was forced to leave in 1992. The Maastricht Treaty, signed in 1992, set out the path to a common currency and the conditions countries had to meet, covering inflation, interest rates, budget deficits and government debt. Supporters argued that a single currency would remove exchange-rate risk within Europe, lower trading costs and deepen financial markets. Critics warned that one interest rate could not suit economies as different as Germany and Portugal. Both arguments would be tested in the decades that followed. See Black Wednesday.
How the switch worked for markets
For financial markets, the change happened overnight. Conversion rates between the old currencies and the euro were fixed permanently on the last day of 1998, so from January 1999 the Deutsche Mark, French franc and the others were simply fixed subdivisions of the euro. Interbank currency trading in those currencies stopped, and dealers quoted the euro against the dollar, yen and pound instead. Everyday cash stayed the same for three more years, until notes and coins arrived in 2002.
Trading before the euro
Before 1999, currency traders dealt in a dozen or so separate European currencies. The dollar against the Deutsche Mark was among the most heavily traded pairs in the world, and the French franc, Italian lira, Dutch guilder and others each had their own markets, spreads and interest rates. Trading between European currencies carried the constant risk that a government would realign or abandon its band, as several did in the early 1990s, sometimes with very little warning. The euro removed those cross-border currency risks overnight for its members and concentrated liquidity in a single pair against the dollar. For businesses trading within the euro area, an entire layer of hedging costs disappeared. For traders, a large set of once-active and liquid markets simply stopped existing at all.
Launch and early slide
- December 31, 1998: fixed conversion rates announced, such as 1.95583 Deutsche Marks per euro.
- January 1, 1999: the euro becomes the currency of 11 countries; the European Central Bank sets one policy for all.
- January 4, 1999: first trading day; the euro trades above $1.18.
- October 2000: record low around $0.82.
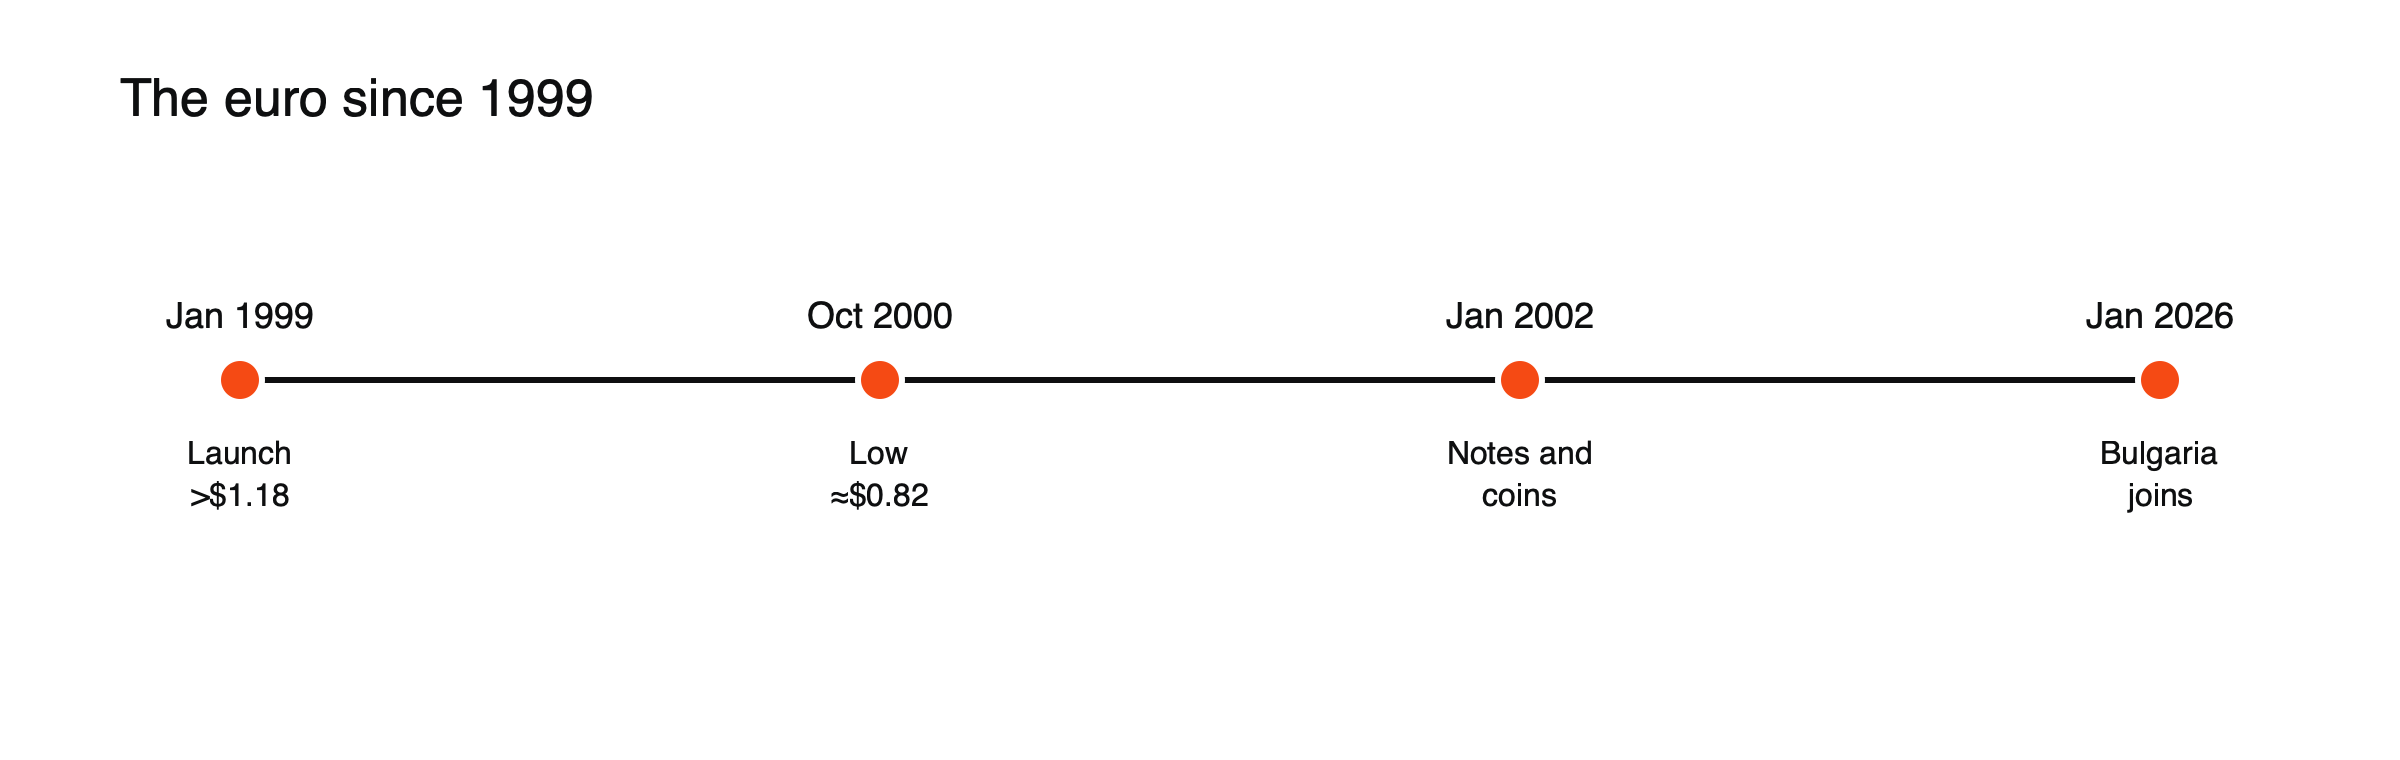
Figure: Key dates in the euro’s history.
Why the euro fell at first
The euro’s early weakness surprised many of its supporters. The United States was growing quickly during the technology boom, drawing investment capital from Europe, and US interest rates were higher for much of the period. The new European Central Bank had no track record, and markets were unsure how it would respond to slower growth in the largest member economies. From above $1.18 at launch, the euro slid steadily, losing close to 30% of its value against the dollar by its low of about $0.8230 in October 2000.
The 2000 intervention
On September 22, 2000, the ECB, the US Federal Reserve, the Bank of Japan and other Group of Seven central banks intervened together to support the euro, the first coordinated G7 intervention since 1995. The surprise action pushed the euro from about 87 US cents to 90 cents before it settled near 88 cents that day. The amounts were modest, reportedly just over €3 billion from the ECB and about $1.5 billion from the Federal Reserve, and within weeks the euro fell below the level at which the intervention had taken place. It did not turn decisively higher until the US economy slowed and the dollar weakened in the following years. See what currency intervention is.
Notes, coins and enlargement
- January 1, 2001: Greece joins.
- January 1, 2002: notes and coins enter circulation; national currencies withdrawn by February 28.
- Since then: membership has grown, with Bulgaria joining on January 1, 2026.
The euro’s long swings
| Period | EUR/USD, approximately | Backdrop |
|---|---|---|
| January 1999 | 1.18 | Launch |
| October 2000 | 0.82 | Strong US growth, doubts about the ECB |
| July 2008 | 1.60 | Weak dollar, global financial crisis building |
| September 2022 | 0.96 | Rapid Fed rate rises, European energy crisis |
| 2024–2025 | 1.04 to 1.12 | Range trading as rate gaps narrowed |
The euro has traded below one dollar during only two periods in its history: in its early years and briefly in late 2022.
Deeper liquidity
Trading in Deutsche Marks, French francs and others merged into the euro, concentrating liquidity in EUR/USD.
A second reserve currency
The euro’s share of global reserves rose from about 18% in 1999 to around a quarter by the late 2000s, second to the dollar.
One policy for many economies
The ECB sets a single rate for countries with different needs, which later produced bond spread tensions. See how the ECB and the Fed differ in moving markets.
Crisis tests
The euro faced its most serious test in the sovereign debt crisis of 2010 to 2012, when markets doubted whether some members could service their debts and whether the currency would survive in its existing form. Bond yields in several countries soared, and the euro fell sharply at times. The crisis eased after the ECB signalled in 2012 that it would do whatever it took to preserve the euro, backed by new tools for buying government bonds. The episode showed that the main risk to a shared currency is not its exchange rate but the strains between member economies.
Lessons
A new currency’s value depends on confidence and policy, not just economic size, as the early slide showed. See what moves EUR/USD and how the forex market works.
What it means for traders today
For currency traders, the euro’s history explains several features of today’s market: why EUR/USD is the most traded pair, why it responds so strongly to the interest rate gap between the ECB and the Federal Reserve and why European political events can move it as much as economic data. Its long swings, from 1.18 to 0.82, up to 1.60 and back below parity, also show that even the most liquid currency pair can trend for years in one direction. See what moves EUR/USD and how the ECB and the Fed differ in moving markets.
Frequently asked questions
How many countries use the euro?
The number has grown from 11 at launch as more European Union members have qualified and joined. Bulgaria became the latest member on January 1, 2026.
Why is EUR/USD quoted with the euro first?
By market convention, the euro is usually the base currency when it is paired with other major currencies, so the quote shows how many dollars one euro buys.
This article is educational content and does not constitute financial, investment, legal or tax advice. Digital assets are volatile and you may lose the amount you invest.
Sources
- Twenty years of the euro: key dates (11 countries; conversion rates; above $1.18 on January 4, 1999; low of $0.8230 in October 2000; notes and coins 2002) — AFP via Daily FT
- The introduction of the euro (national notes withdrawn by February 28, 2002; Bulgaria from January 1, 2026) — Banco de España
- The euro celebrates its 10th birthday (reserve share from 18% in 1999 to 27%) — UCG, 2008
- Euro parity: what will it take to drive EUR/USD to 1.00? (low of 0.8230 in late 2000; above 1.60 by 2008; below parity in late 2022; only two periods below parity) — Forex.com
- The euro’s collapse prompted G7 intervention (first coordinated G7 intervention since 1995; euro from 87 to 90 cents, settling at 88.20) — European Sources Online, September 2000
- Should the ECB intervene to support the euro? (G7 intervention on September 22, 2000; just over €3 billion from the ECB, $1.5 billion from the Fed; euro later below the intervention level) — CESifo Forum
- What happens when the euro hits parity with the dollar (peak near 1.60 in July 2008; 0.96 in September 2022; 1.04–1.12 range in 2024–2025) — ConvexTrade