
What Is the Yield Curve?
The yield curve plots government bond yields from short to long maturities. Normal, flat and inverted shapes, what moves each end and how traders read it.
The yield curve plots government bond yields across maturities, from months to 30 years. It normally slopes upward, as lenders want more yield for longer terms, and its shape reflects expectations for policy, growth and inflation. When short yields exceed long ones it “inverts,” which often preceded recessions; the 2s10s spread is the key gauge.
The main shapes
- Normal (upward-sloping): long yields above short yields; typical in expansions.
- Flat: little difference; often during transitions.
- Inverted: short yields above long yields; markets expect rate cuts ahead. See what an inverted yield curve means.
- Steepening: the gap widening, either because long yields rise or short yields fall. See what a steepening yield curve means.
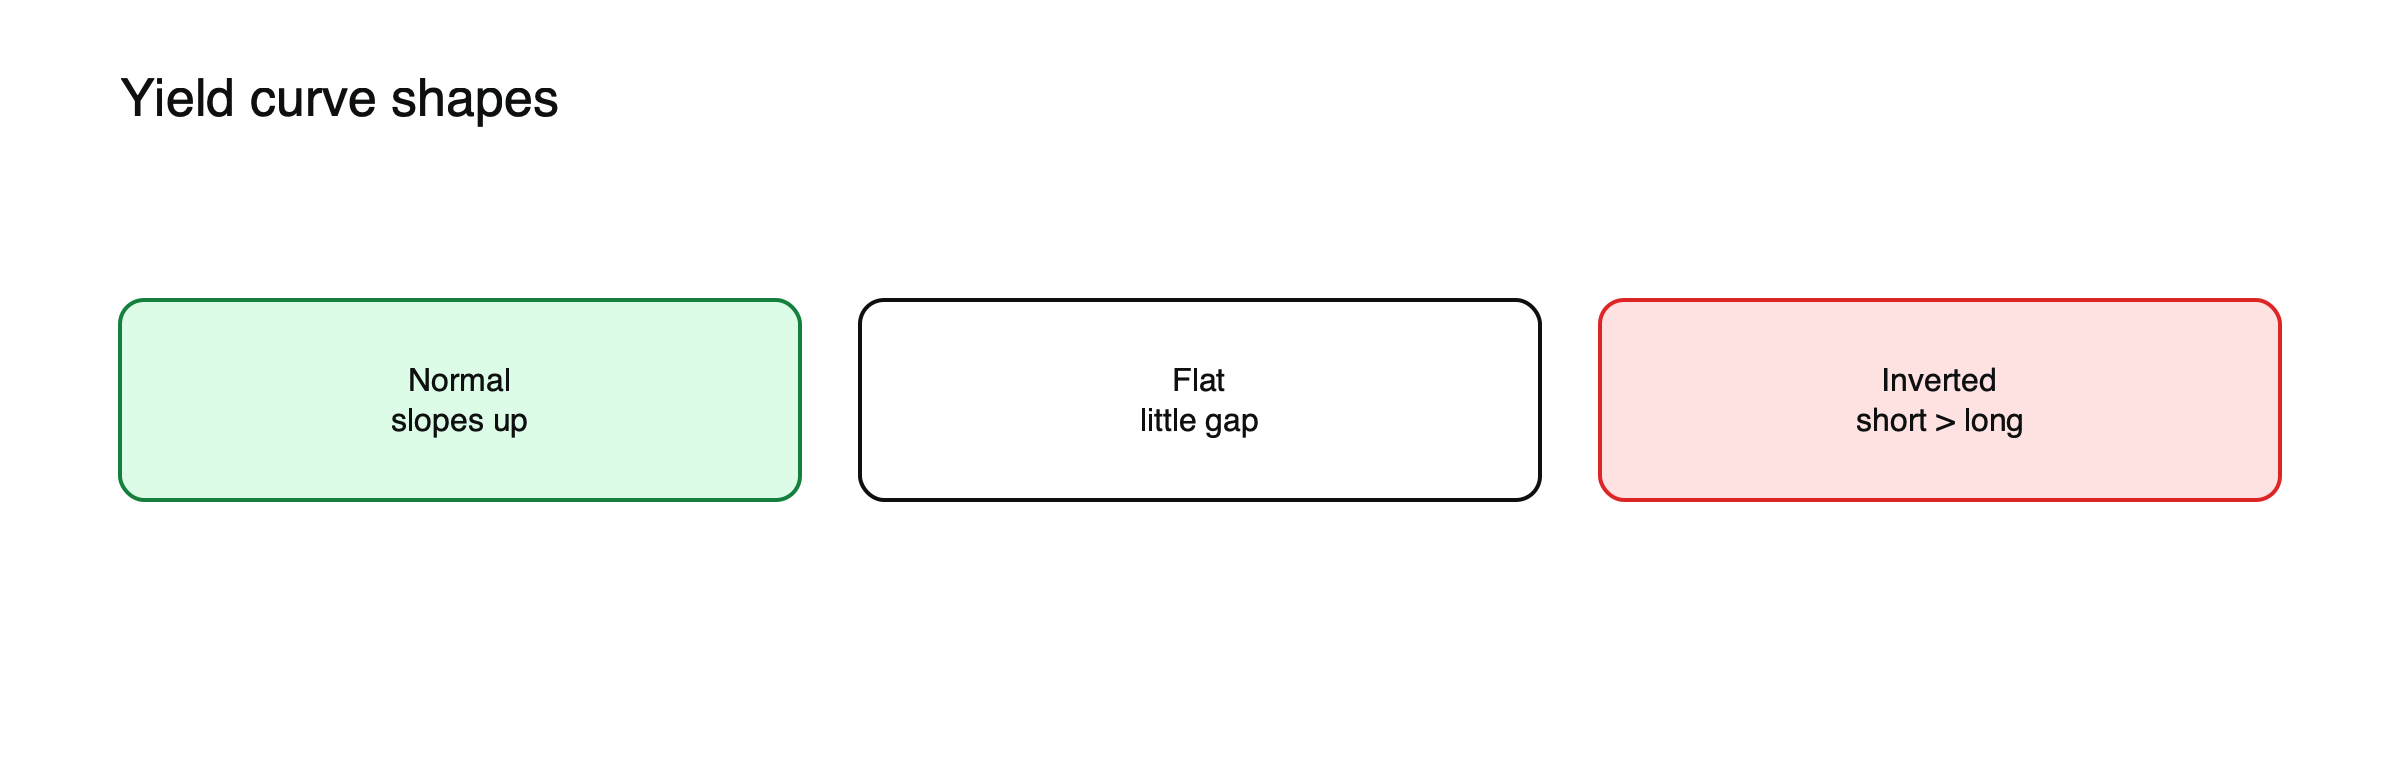
Figure: The main curve shapes.
Reading a curve, illustrated
| Maturity | Normal curve | Inverted curve |
|---|---|---|
| 3 months | 2.0% | 5.3% |
| 2 years | 2.6% | 4.9% |
| 5 years | 3.1% | 4.3% |
| 10 years | 3.6% | 4.0% |
| 30 years | 4.0% | 4.1% |
(Illustrative yields.) In the normal curve, each longer maturity yields more. In the inverted curve, short yields are highest, because the central bank has raised rates sharply and markets expect cuts later.
What moves each end
- Short end: central bank policy rate expectations.
- Long end: growth, inflation expectations, government borrowing and the extra return investors demand for lending long.
Recent history
The 2s10s curve inverted in July 2022, reached about −1.08 points in July 2023, and un-inverted in September 2024 after 26 months.
Measuring the slope
The most quoted measure is the 2s10s spread, the 10-year yield minus the 2-year yield. Many economists also follow the gap between the 10-year yield and the 3-month bill yield, which some research finds a better recession signal. Both are usually positive; negative readings mean the curve is inverted between those points.
Bull and bear moves
Curve moves are described by direction and cause. A bull steepening comes from short yields falling faster than long ones, often as rate cuts approach. A bear steepening comes from long yields rising faster, often on inflation or borrowing worries. A bull flattening sees long yields fall faster; a bear flattening sees short yields rise faster, typical when a central bank tightens. Each points to a different economic story.
Why traders watch it. It affects bank profits, currencies and equity sectors, and is used as a recession indicator, though with long and variable lags.
See what moves the 10-year Treasury yield and how bonds work.
Term premium
Part of the extra yield on long bonds is compensation for the risk of locking money up for years, known as the term premium. It cannot be observed directly but is estimated by models. When investors worry about inflation or heavy government borrowing, the term premium tends to rise, steepening the curve even without changes in expected policy rates.
Banks and the curve
Banks borrow short and lend long, so a steep curve tends to help their profits and an inverted one squeezes them. Bank shares often react to changes in the curve’s slope, which is one reason equity traders follow it.
Trading the curve
Traders express views on the curve by taking opposite positions in two maturities, for example buying 2-year and selling 10-year futures to profit from steepening. Positions are sized so that each leg has similar sensitivity to yields, measured by DV01, so that the trade profits from changes in the slope rather than the overall level. See how bond duration predicts price moves.
Curves in other countries
Every major government bond market has its own curve: German Bunds, UK gilts and Japanese government bonds among them. Comparing curves across countries shows differences in policy expectations and helps explain currency moves.
Why inversions happen
Curves usually invert when a central bank raises short-term rates sharply to fight inflation. Short yields rise with policy rates, while long yields rise less because investors expect the tightening to slow the economy and force rate cuts later. In 2022 and 2023, as the Federal Reserve raised rates rapidly, the 2-year yield rose above the 10-year, and the 2s10s spread reached about −1.08 points in July 2023, its deepest inversion in decades.
After un-inversion
Historically, recessions have often begun after the curve returned to a positive slope, rather than while it was inverted, typically as the central bank cut short rates in response to weakening growth. The curve un-inverted in September 2024 after 26 months, and as of 2026 a US recession had not followed, a reminder that the signal is imperfect.
Curves and currencies
Differences between countries’ curves influence exchange rates. When one country’s short-term yields rise relative to another’s, its currency often strengthens. Changes in the slope can also signal shifting expectations for growth, which feed into currency moves. See how interest rate differentials move currencies.
When a central bank controls the curve
From 2016, the Bank of Japan targeted not only short-term rates but also the 10-year government bond yield, buying bonds as needed to hold it near its target, a policy known as yield curve control. It gradually loosened the policy and ended it in 2024. While it lasted, the Japanese curve’s long end reflected policy more than market expectations.
Common misreadings
- Treating an inversion as a precise recession timer.
- Ignoring why the curve moved, not just how.
The long end and government borrowing
Long-term yields can rise when investors worry about heavy government borrowing, high inflation or the independence of central banks, even if policy rates are stable. Such moves steepen the curve and raise borrowing costs across the economy. The UK gilt crisis of 2022 showed how quickly long yields can jump when confidence in fiscal policy falls. See what happened in the UK gilt crisis.
The curve and share sectors
A steepening curve often favors banks, insurers and economically sensitive sectors, because it signals stronger growth and wider lending margins. A flattening or inverting curve tends to favor defensive sectors. Equity traders use curve moves as one input when rotating between sectors. See what sector rotation is.
Where to see the curve
Government bond yields across maturities are published daily by financial websites and central banks, and many charting platforms show the curve and its history. Comparing today’s curve with one from a year ago shows how expectations have shifted.
Forward rates
The yield curve contains the market’s implied path for future rates. If the 1-year yield is 4% and the 2-year yield is 4.5%, the implied 1-year rate starting in one year is about 5%, because a 1-year investment followed by another should earn roughly the same as a 2-year one. (Example values.) These implied forward rates are a starting point for judging what the market expects central banks to do, though they also include risk premiums.
A curve checklist
- Is the curve normal, flat or inverted?
- Is it steepening or flattening, and is the move led by short or long yields?
- What do central bank expectations imply for the short end?
- Are inflation or borrowing worries lifting the long end?
- How are banks and other rate-sensitive sectors reacting?
Working through these questions turns a line on a chart into a view on policy, growth and markets.
Steepening after cuts
When central banks begin cutting rates after a period of tightening, short yields usually fall first and fastest, steepening the curve. If investors also worry that cuts will revive inflation or that government borrowing will stay high, long yields may fall little or even rise, steepening it further. Such bear steepening after cuts can surprise investors who expected long bonds to rally once rates started coming down. Watching the long end closely after the first rate cuts often helps avoid that unpleasant surprise in practice.
Frequently asked questions
Does an inverted curve always mean a recession?
No. It has preceded most US recessions since the 1970s, but the inversion of 2022 to 2024 had not been followed by one as of 2026, and the timing has varied widely.
Who controls the yield curve?
Central banks largely set the short end through policy rates; the long end is set by markets, though central banks can influence it through bond purchases.
This article is educational content and does not constitute financial, investment, legal or tax advice. Digital assets are volatile and you may lose the amount you invest.
Sources
- 2s10s yield curve inversion history (five inversions since 1976 followed by recession; 26-month 2022–2024 inversion without one as of 2026) — Eco3min
- The Yield Curve Manual (deepest inversion −1.08 points in July 2023; un-inversion before past recessions) — TheTrading.Tools
- What happened after the yield curve un-inverted? (September 2024 after 26 months) — MarketCrash.net