
What Is EV/EBITDA and When Is It Better Than P/E?
EV/EBITDA compares a company's whole value, including debt, with operating earnings before depreciation. How to calculate it and when it beats P/E.
EV/EBITDA compares enterprise value, market value plus debt minus cash, with earnings before interest, taxes, depreciation and amortization. Because it includes debt and ignores financing and accounting choices, it often beats P/E for comparing companies with different debt. An EV of $2.2 billion on $200 million of EBITDA is 11 times.
How to calculate it
- Enterprise value (EV) = market capitalization + debt − cash
- EBITDA = operating income + depreciation and amortization
- EV/EBITDA = EV ÷ EBITDA
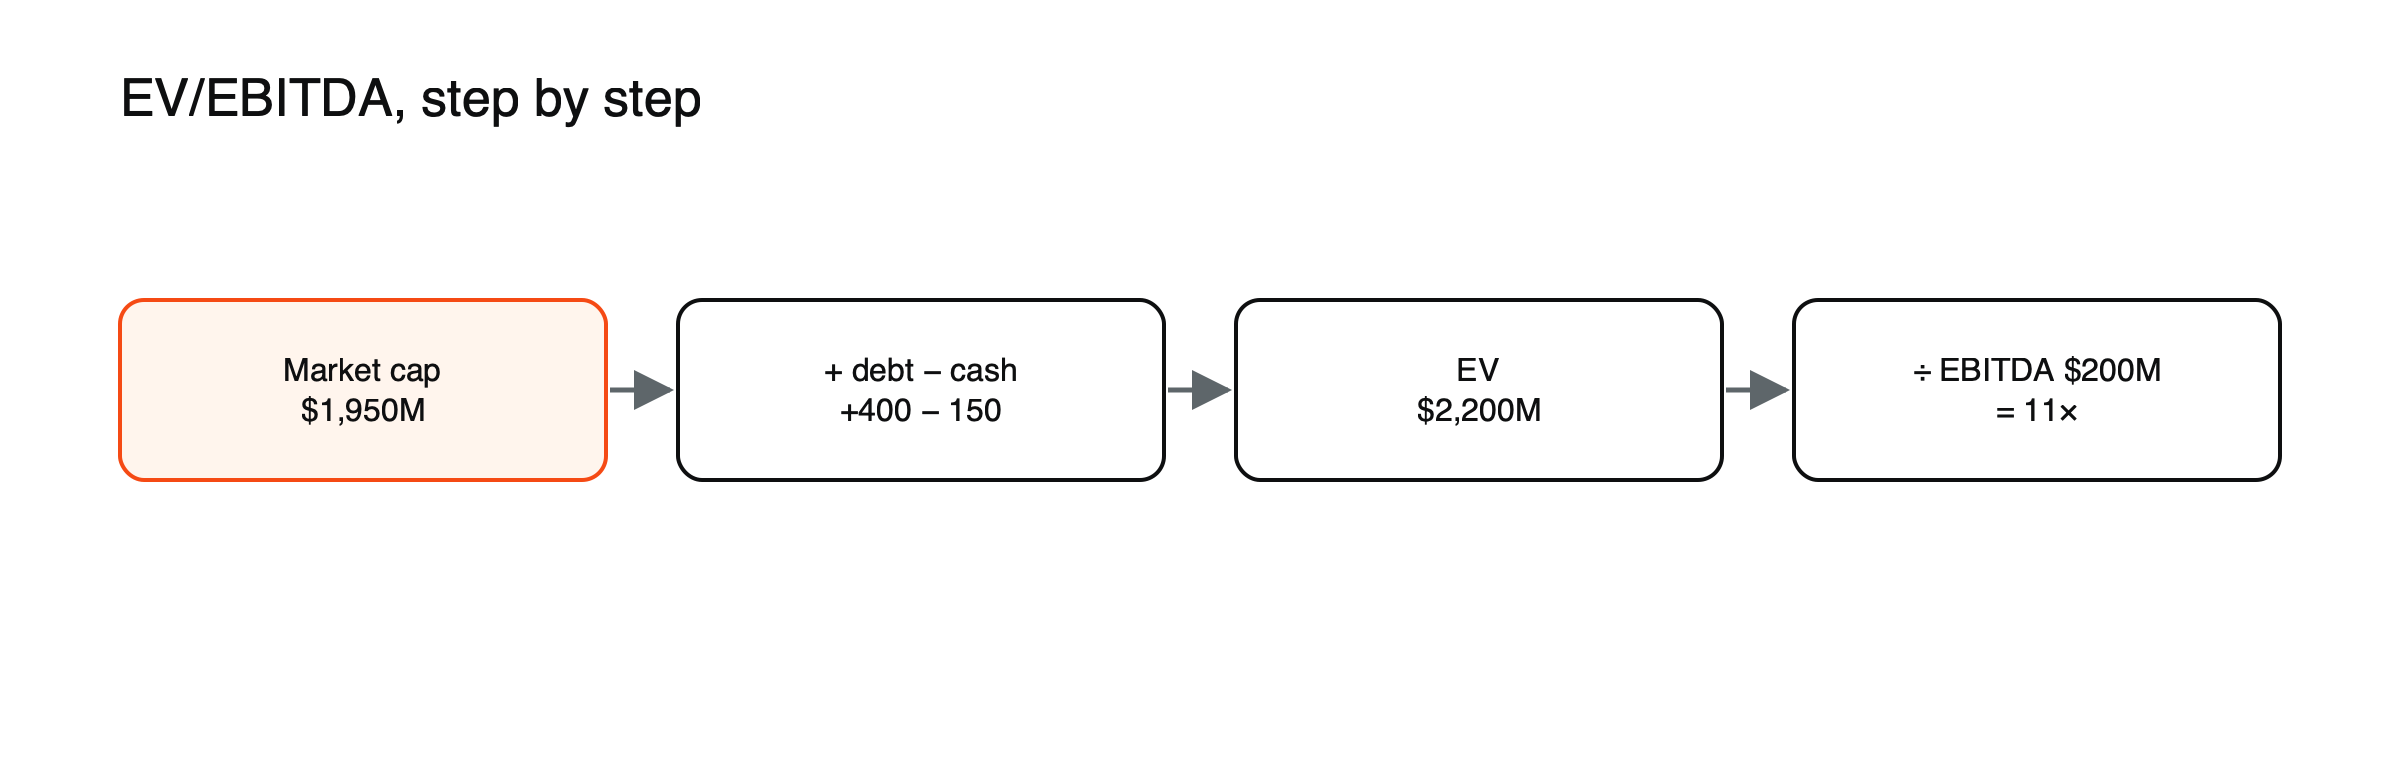
Figure: From market cap to EV/EBITDA (hypothetical example, $ million).
Worked example (ExampleCo)
- Share price $39 × 50 million shares = market cap $1,950 million
- Debt $400 million, cash $150 million → EV = $2,200 million
- Operating income $150 million + D&A $50 million = EBITDA $200 million
- EV/EBITDA = 11×; for comparison, P/E = 39 ÷ 1.95 = 20×
Two companies, worked through
Company X and Company Y each have a market value of $1,000 million and a P/E of 10. X has no debt and EBITDA of $160 million; Y has $1,500 million of net debt and EBITDA of $300 million. X’s EV/EBITDA is 1,000 ÷ 160 ≈ 6.3; Y’s is 2,500 ÷ 300 ≈ 8.3. On P/E they look equally priced; on EV/EBITDA, Y is about a third more expensive, because buying it means taking on its debt. Y’s net debt is also five times its EBITDA, a risk the P/E ignores. (Hypothetical figures.)
When it is better than P/E
- Different debt levels: P/E ignores debt; EV includes it.
- Takeover analysis: a buyer pays for the whole company, including debt.
- Different tax or depreciation policies across countries or sectors.
What goes into enterprise value
The basic formula adds debt and subtracts cash, but a full calculation often adds other claims on the business: lease liabilities, preferred shares, minority interests in subsidiaries and sometimes pension deficits. Different data providers include different items, so EV/EBITDA figures for the same company can vary between sources. Comparing companies using the same source and method keeps the comparison fair.
Related measures
- EV/EBIT uses operating income after depreciation, better reflecting the cost of equipment for capital-heavy businesses. ExampleCo’s EV/EBIT is 2,200 ÷ 150 ≈ 14.7.
- EV/sales compares enterprise value with revenue, useful for companies with little or no profit. ExampleCo’s is 2,200 ÷ 1,000 = 2.2.
- EV/free cash flow compares value with cash generation after investment.
(Hypothetical figures.)
Limits
EBITDA ignores capital spending, which can be large for industrial or telecom companies; free cash flow may be better there. See how to calculate free cash flow. It also ignores interest, which matters when debt is heavy.
See how to calculate and read a P/E ratio and what moves stock prices.
EV/EBITDA in takeovers
Because a buyer acquires the whole company, including its debt, takeover prices are often described as multiples of EBITDA. If similar businesses have changed hands at 12 times EBITDA, a listed company trading at 9 times may attract interest from buyers. Takeover premiums, often 20% to 40% above the market price, are frequently justified by cost savings the buyer expects, which would raise EBITDA after the deal.
Adjusted EBITDA
Companies often report adjusted EBITDA, excluding items such as share-based pay, restructuring or acquisition costs. Adjustments can be reasonable, but they can also inflate EBITDA and make valuations and debt ratios look better than they are. Lenders and investors increasingly scrutinize how far adjusted EBITDA differs from the unadjusted figure.
Sector differences
Typical EV/EBITDA multiples vary widely: fast-growing technology companies often trade at high multiples, while utilities, telecoms and mature industrial firms usually trade lower. As with P/E, the most useful comparisons are within a sector and against a company’s own history.
From a multiple back to a share price
Multiples can be turned into an estimated value. If similar companies trade at 12 times EBITDA, applying that multiple to ExampleCo’s $200 million of EBITDA gives an enterprise value of $2,400 million. Subtracting net debt of $250 million leaves equity worth $2,150 million, or about $43 a share against the current $39. If peers trade at only 9 times, the same method gives about $31 a share. (Hypothetical figures.) The result depends entirely on the multiple chosen, which is why analysts look at a range of peers rather than a single number.
Debt as risk, not just cost
EV/EBITDA adds debt to value, but it does not show how risky that debt is. Net debt divided by EBITDA does: ExampleCo’s ratio of 1.25 is modest, while a company at 5 times or more depends heavily on stable earnings and willing lenders. Two companies with the same EV/EBITDA can carry very different risks if one is financed mainly by debt and the other by equity.
Cyclical EBITDA
As with P/E, a low EV/EBITDA for a cyclical company may reflect peak earnings. If EBITDA falls by half in a downturn, a multiple of 6 becomes 12 on the same enterprise value, and higher still if debt rises. Using average EBITDA over a cycle, or forecasts for a weaker year, gives a fairer comparison.
Common misreadings
- Comparing EV/EBITDA across industries with very different capital needs.
- Ignoring leases and other debt-like items.
- Treating adjusted EBITDA as equivalent to cash flow.
ExampleCo against peers
| Company | EV/EBITDA | Net debt/EBITDA | Growth outlook |
|---|---|---|---|
| ExampleCo | 11.0× | 1.3× | Moderate |
| Peer 1 | 9.0× | 3.0× | Slow |
| Peer 2 | 12.5× | 0.5× | Moderate |
| Peer 3 | 14.0× | Net cash | Fast |
(Hypothetical companies.) ExampleCo sits in the middle of the range. Peer 1 looks cheaper but carries far more debt and slower growth; Peer 3 looks expensive but has net cash and faster growth. The table shows why a single multiple rarely settles whether a share is cheap: the reasons behind each number matter as much as the number itself.
How traders use it
Traders rarely act on EV/EBITDA alone, but sharp changes in a company’s multiple relative to peers can signal shifting sentiment, a possible takeover target or problems the market has spotted. Around results, revisions to EBITDA forecasts move the multiple as much as price changes do. Comparing the multiple before and after a large share price move shows whether the move reflected new earnings expectations or a change in what investors are willing to pay.
A quick EV/EBITDA check
- Which items are included in enterprise value: leases, preferred shares, minority interests?
- Is EBITDA reported or adjusted, and how large are the adjustments?
- How much of EBITDA is needed for capital spending?
- Is EBITDA near a cyclical peak or trough?
- How does the multiple compare with close peers and with the company’s own history?
- Would the conclusion change if using EV/EBIT or free cash flow instead?
Answering these keeps a single multiple in its proper context and avoids false precision.
Frequently asked questions
Why use EBITDA instead of net income?
EBITDA is closer to operating cash generation and is unaffected by how a company is financed or how it depreciates assets, which makes comparisons across companies with different debt and accounting easier.
Can EV be lower than market value?
Yes, when a company holds more cash than debt. Net cash is subtracted, so EV falls below market capitalization.
Company figures in this article are a hypothetical example (“ExampleCo”) for illustration.
This article is educational content and does not constitute financial, investment, legal or tax advice. Digital assets are volatile and you may lose the amount you invest.