
How to Read an Earnings Report
Compare revenue and EPS with estimates, then read guidance, margins and key metrics, check one-offs and listen to the call: how to read an earnings report.
To read an earnings report, compare headline revenue and earnings per share with analyst estimates, then read the guidance, check margins and the company’s key business metrics, look for one-off items, and listen to the earnings call for management’s tone. Markets react to the whole picture against expectations, not just the headline beat or miss.
Before you start
Note consensus estimates for revenue, EPS and any key metrics, and how the stock moved into the report.
Reading it, in order
Headline numbers
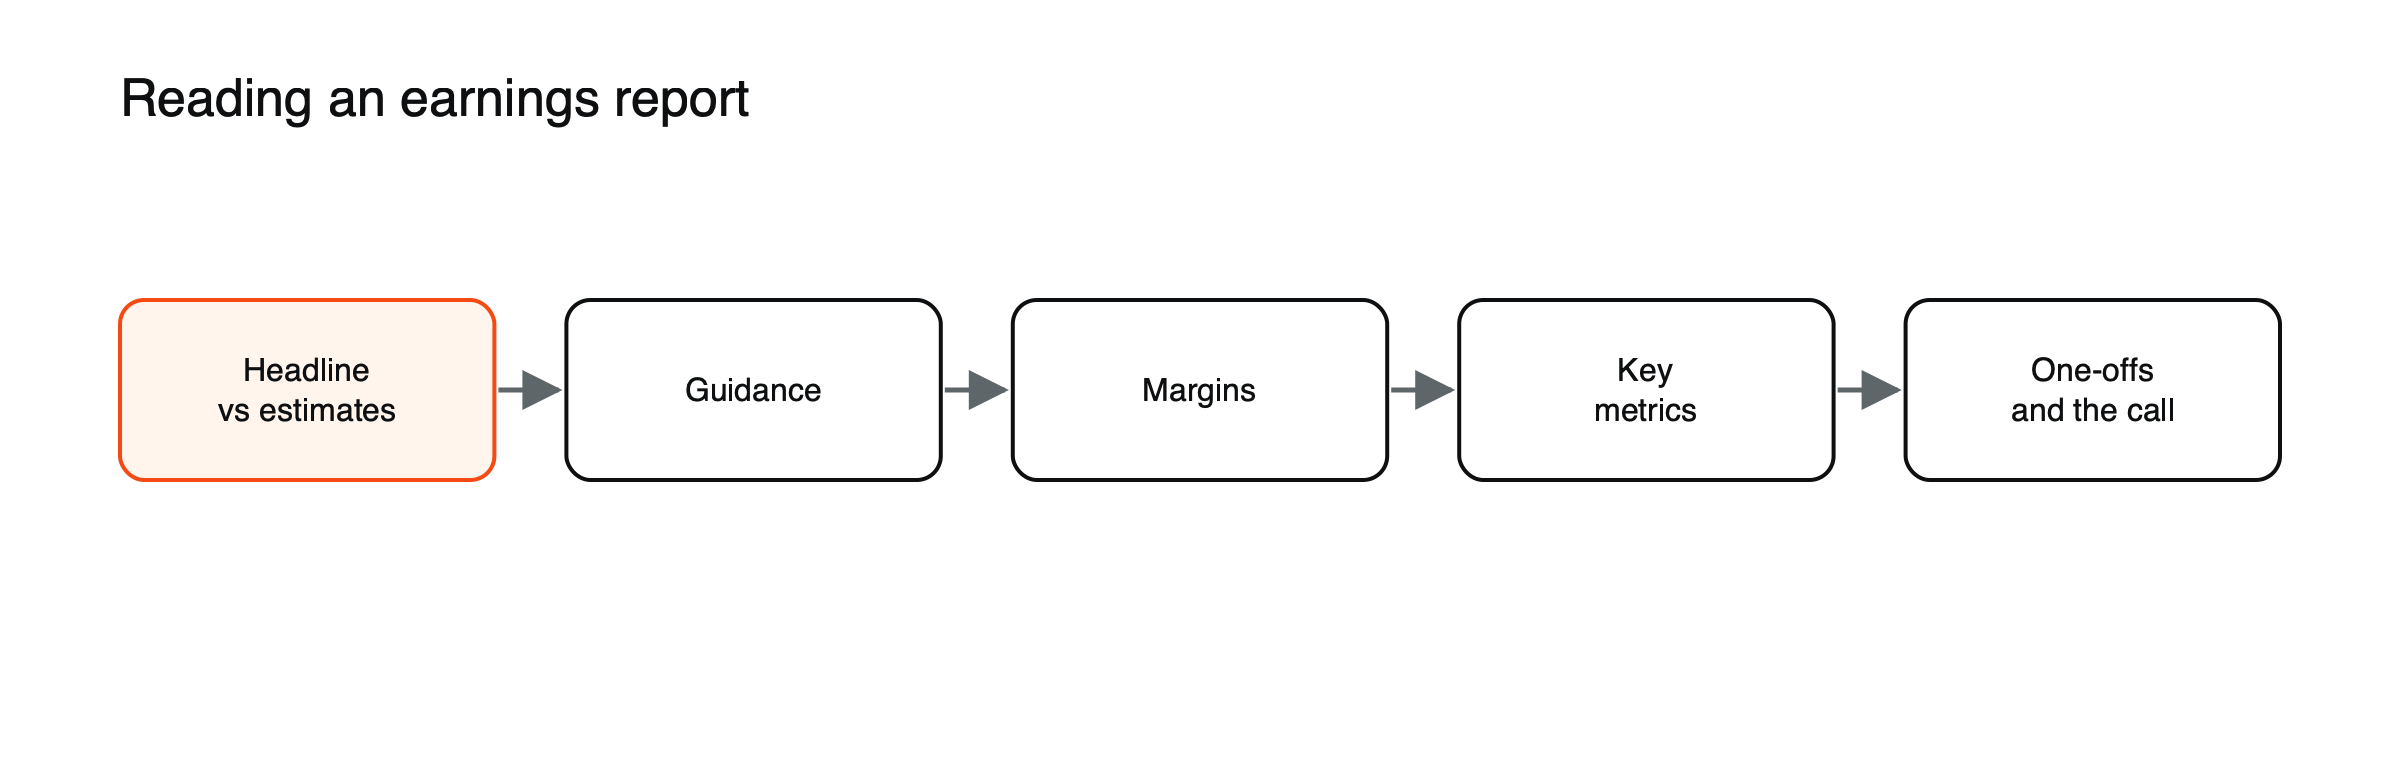
Figure: Reading an earnings report in order.
Revenue and EPS against estimates. See how earnings per share is calculated.
Guidance
The forecast for the next quarter or year, often the biggest driver. See what company guidance is.
Margins
Gross and operating margin compared with last year. See how to calculate gross, operating and net margin.
Key metrics
Industry-specific measures such as users, subscribers, same-store sales or orders.
One-offs and adjustments
Compare adjusted and reported figures.
The earnings call
Management’s tone and answers to analysts’ questions.
What a results release contains
A typical release opens with headline figures and management comments, followed by guidance, tables comparing the quarter with the same period a year earlier, segment breakdowns and a reconciliation between adjusted and reported figures. Many companies also publish a slide presentation and hold a conference call. Full financial statements are filed with regulators, such as on Form 8-K or 10-Q in the United States.
A read-through, illustrated
| Item | Consensus | Reported |
|---|---|---|
| Revenue | $2.50 billion | $2.55 billion |
| Adjusted EPS | $1.20 | $1.26 |
| Gross margin | 42.0% | 41.2% |
| Next-quarter revenue guidance | $2.65 billion | $2.55–2.60 billion |
(Hypothetical company.) Revenue and EPS beat, but gross margin slipped and the guidance range sits below consensus at its midpoint of about $2.575 billion. A trader who stopped at the first two lines would see a clean beat; one who read all four would expect the share to struggle, and on the call would listen for whether the margin and guidance weakness is temporary.
Reading guidance ranges
Companies often guide with a range. Compare the midpoint with consensus, and note whether the range has been raised, lowered or kept unchanged since the last report. A raised range whose midpoint is still below consensus can disappoint; an unchanged range when analysts expected a cut can be a relief. See what company guidance is.
The earnings call
Calls usually have two parts: prepared remarks from management and a question-and-answer session with analysts. The questions often reveal what investors are most worried about, and management’s answers, or refusals to answer, can move the shares more than the prepared remarks. Words such as “cautious,” “softening” or “headwinds” often signal weaker periods ahead.
Example
In February 2022, Meta’s report included a rare profit decline and weak revenue guidance; the stock fell 26% the next day. In May 2023, Nvidia beat its quarterly forecasts, but the real news was guidance of about $11 billion of revenue for the next quarter against consensus near $7.2 billion; the shares rose 24%. See how earnings reports move share prices.
Common mistakes
Reacting to the first headline, and ignoring guidance and cash flow. See what moves stock prices.
Where to find the documents
Results releases appear on companies’ investor relations websites and through news services at the moment of publication. Regulatory filings follow on official databases such as the SEC’s EDGAR system. Recordings or transcripts of calls are usually available soon afterward. Consensus estimates are compiled by data providers and widely reported in financial news before each release.
A one-page template
- Revenue and EPS: actual vs consensus, beat or miss in percent.
- Guidance: new range, midpoint vs consensus, raised or lowered.
- Margins: gross and operating, vs last year and vs expectations.
- Key metric: actual vs expectations.
- One-offs: what was excluded from adjusted figures.
- Call: main concerns raised and management’s tone.
- Initial reaction and whether it seems consistent with the details.
What to focus on by industry
| Industry | Key figures beyond revenue and EPS |
|---|---|
| Banks | Net interest margin, loan growth, credit losses, capital ratios |
| Retailers | Same-store sales, inventory levels, gross margin |
| Software | Recurring revenue, customer retention, billings |
| Energy | Production volumes, realized prices, capital spending |
| Subscription media | Subscriber numbers, revenue per user |
Knowing the figures that matter for each industry tells you where to look first in a long release.
Comparing with last year
Most companies compare each quarter with the same quarter a year earlier, because many businesses are seasonal. Growth rates, margin changes and trends in key metrics over several quarters say more than any single figure. A company growing 10% after several quarters at 20% may beat consensus yet still show slowing momentum, which investors notice.
Cash flow and the balance sheet
Many releases include a cash flow summary and balance sheet. Check whether operating cash flow kept pace with profits, whether inventories or receivables jumped and whether debt rose or fell. These details often explain later moves that the headline numbers do not. See how to read a cash flow statement.
Common traps in releases
Companies naturally highlight their best figures. Releases may lead with adjusted earnings, a record in one metric or growth excluding currency effects, while weaker numbers appear further down. Reading the full tables, not just the opening paragraphs, and comparing adjusted with reported figures avoids being guided by the company’s own emphasis.
Measuring beats and misses in percent
Expressing surprises as percentages makes them comparable. In the illustrated example above, revenue beat by $50 million on $2.50 billion, about 2%, while EPS beat by $0.06 on $1.20, about 5%. Guidance at its midpoint fell short by about 3%. A 5% EPS beat sounds strong, but a 3% shortfall in guidance usually matters more for the share price, because it affects every future quarter rather than one.
Timing within the season
Where a company reports within earnings season affects how its results are read. Early reporters set expectations for their sectors; later reporters are judged partly against what peers have already said. A company reporting after several peers have warned about demand may see a small beat welcomed with relief, while the same result after strong peer reports might disappoint.
A cautious call, illustrated
Suppose a company reports in line with forecasts and keeps its guidance unchanged, and the shares are flat after hours. On the call, the finance chief says orders “slowed through the final weeks of the quarter” and declines to comment on the next quarter beyond the existing guidance. Analysts press on the point, and the shares slip 5% by the end of the call. (Hypothetical scenario.) Nothing in the written release changed; the tone of the answers did. This is why the call deserves as much attention as the numbers.
Keeping a results log
Recording each report’s key surprises, the guidance change and the share’s reaction over one day and one week builds a useful history. After a few quarters, the log shows which figures move each share most, how reliably management’s guidance has held and whether first reactions tend to last or reverse. That history makes the next report easier to read. It helps you notice when a company starts emphasizing new metrics, which can be a sign that older ones have stopped flattering it.
Frequently asked questions
What matters more, revenue or EPS?
Both matter, but revenue shows demand, while EPS can be shaped by costs, taxes and buybacks. Investors usually prefer beats driven by revenue. See revenue vs earnings.
How quickly should I read a report?
Fast enough to know the key facts before acting, but there is rarely a reason to trade in the first minutes. Reading all the main items first usually produces better decisions.
This article is educational content and does not constitute financial, investment, legal or tax advice. Digital assets are volatile and you may lose the amount you invest.
Sources
- Why Meta shares nosedived (rare profit decline; weak revenue forecast) — The Week, February 2022
- Meta shares plummet on tepid forecast (guidance drove the move) — Reuters via Euronews
- Why Nvidia stock skyrocketed 239% in 2023 (Q2 revenue guidance of $11 billion vs $7.2 billion consensus; shares +24% on May 25, 2023) — The Motley Fool, January 2024
- Nvidia Q1 beat (EPS $1.09 vs $0.92 expected; revenue $7.19 billion vs $6.52 billion) — StreetBeat / Benzinga, May 2023