
How Stock Beta Is Calculated and What It Tells You
Beta measures how much a stock tends to move relative to the market: covariance ÷ market variance. A beta of 1.5 implies about 15% on a 10% market move.
Stock beta measures how much a stock has tended to move relative to the market: 1 means in line, 1.5 means about 50% more, 0.5 about half as much. It is calculated from past returns as covariance with the market divided by market variance. A beta of 1.5 implies about a 15% fall if the market drops 10%.
The formula
Beta = covariance(stock returns, market returns) ÷ variance(market returns)
In practice, beta is the slope of a line fitted through a scatter of the stock’s returns against the market’s, often using weekly or monthly returns over two to five years.
Worked example
Suppose that over many periods, whenever the market rose or fell 2%, the stock rose or fell about 3% on average. The slope is 3 ÷ 2 = 1.5. (Example values.)
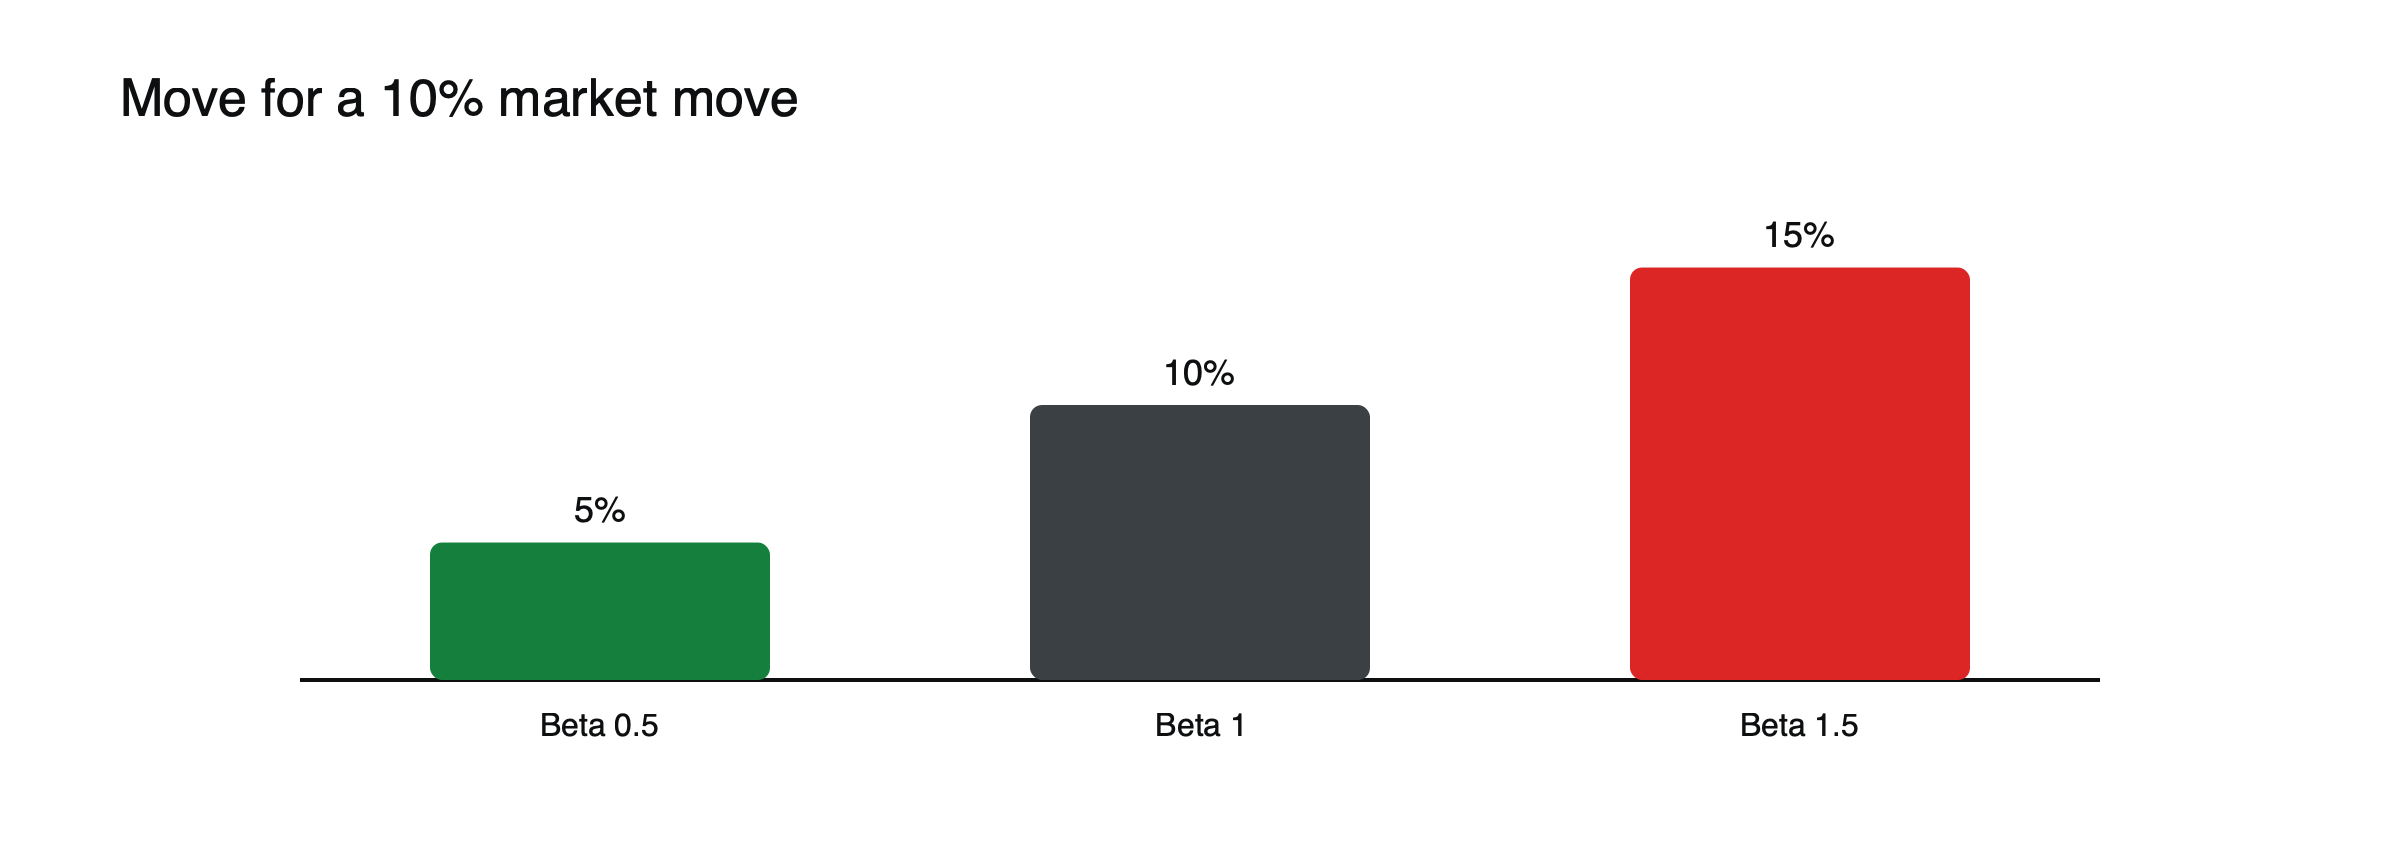
Figure: Expected moves for a 10% market move (example).
| Market move | Expected stock move (beta 1.5) |
|---|---|
| +10% | about +15% |
| −10% | about −15% |
A calculation with real numbers
| Period | Market return | Stock return |
|---|---|---|
| 1 | +2.0% | +3.2% |
| 2 | −1.0% | −1.1% |
| 3 | +3.0% | +4.1% |
| 4 | −2.0% | −3.3% |
| 5 | +1.0% | +1.4% |
| 6 | −3.0% | −4.0% |
(Illustrative returns.) The market’s average return is 0%, its variance about 5.6, and the covariance between the stock and the market about 7.96. Beta = 7.96 ÷ 5.6 ≈ 1.42: the stock has tended to move about 1.4 times as much as the market. In practice, many more periods are used, and spreadsheet functions do the arithmetic.
Beta and correlation
Beta combines two things: how closely a stock moves with the market, its correlation, and how volatile it is compared with the market. Beta = correlation × (stock volatility ÷ market volatility). A very volatile stock with a low correlation can have a modest beta, which is why beta alone understates the risk of shares driven mainly by their own news.
Reading the number
- Beta 1: moves with the market.
- Above 1: amplifies market moves, typical of many cyclical and growth stocks.
- Below 1: dampens them, typical of many defensive stocks.
- Negative: tends to move against the market, which is rare.
Where to find beta
Data providers publish beta, but figures differ with the period, return frequency and benchmark used, so check how it was calculated.
How to use beta
- Position sizing: a high-beta stock needs a smaller position for the same market risk.
- Portfolio risk: add up exposure × beta to estimate total market sensitivity. See how to calculate your exposure on a stock CFD.
- Hedging: beta tells you how much index exposure offsets a stock position.
Beta-adjusted sizing, worked through
Suppose you want each position to carry about the same market risk as $10,000 of the index. For a stock with a beta of 1.5, the position should be about $10,000 ÷ 1.5 = $6,667; for a stock with a beta of 0.8, about $12,500. Both would then be expected to move by roughly the same amount in a market-wide swing, though company news can still move either far more. (Illustrative figures.)
Hedging with an index, worked through
A trader holds $30,000 of a stock with a beta of 1.2 and wants to remove market risk ahead of a central bank decision while keeping the company-specific view. Shorting about $30,000 × 1.2 = $36,000 of an index CFD roughly offsets the market exposure. If the market falls 3%, the stock might fall about 3.6%, a loss of about $1,080, while the index short gains about $1,080. The hedge does nothing about company news. (Illustrative figures.)
Beta by sector
Utilities, consumer staples and healthcare often have betas below 1. Technology, consumer discretionary, industrials and financials often have betas above 1. Individual companies vary widely within sectors, and betas change as businesses evolve.
Limits
Beta is backward-looking, changes over time, depends on the period and index used, and ignores company-specific shocks, such as an earnings gap. A low-beta stock can still fall sharply on its own news.
See cyclical vs defensive stocks and what moves stock prices.
Beta in a crisis
In sharp sell-offs, correlations between stocks rise, and many betas move closer to 1 or above, so diversification and low-beta holdings protect less than usual. Defensive shares with low betas in calm markets can fall sharply in a liquidity panic. Beta estimated from calm periods can therefore understate risk at exactly the wrong moment.
Common misreadings
- Treating beta as a measure of total risk.
- Using a beta calculated over a period that no longer reflects the business.
- Assuming a low-beta stock cannot fall far.
Beta and expected returns
In the capital asset pricing model, a standard finance theory, a stock’s expected return equals the risk-free rate plus its beta times the market’s expected extra return. With a risk-free rate of 4% and a market premium of 5%, a stock with a beta of 1.42 would be expected to return about 11.1% a year, and one with a beta of 0.8 about 8%. (Illustrative assumptions.) The model is a simplification, and real returns often differ, but it is widely used to estimate the cost of equity for valuations.
Beta of a portfolio
A portfolio’s beta is the weighted average of its holdings’ betas. A portfolio of half a 1.4-beta stock and half a 0.8-beta stock has a beta of about 1.1. Long and short positions offset each other: a long of beta 1.2 and a short of equal value in a stock of beta 1.0 leaves a net beta of about 0.2 times the position size.
Upside and downside beta
Some stocks move differently in rising and falling markets. A share might rise only slightly more than the market on good days but fall much more on bad ones. Calculating beta separately for up and down periods can reveal that asymmetry, which a single beta hides. Downside beta matters most for risk management.
Updating beta
Because businesses change through acquisitions, new products or changes in debt, a beta from five years ago may no longer fit. Many analysts use two years of weekly data as a balance between enough observations and recent relevance, and adjust estimates toward 1, since extreme betas tend to drift toward the average over time.
Beta for CFD traders
For CFD traders, beta is most useful for sizing positions so that market moves affect each one similarly, and for judging how much an account would gain or lose in a broad market move. Multiplying each position’s exposure by its beta and adding them up gives a quick estimate of overall market sensitivity.
Beta and leverage
Leverage multiplies the market exposure that beta describes. A trader with $5,000 of margin holding $25,000 of a stock with a beta of 1.4 effectively carries about $35,000 of market-equivalent exposure, seven times the margin. A 5% market fall would be expected to cost about $1,750 from market movement alone, before any company news. (Illustrative figures.)
Choosing the benchmark
Beta depends on the index it is measured against. A European share’s beta against a European index can differ from its beta against a global or US index. For shares outside the US, using the local market or a regional index usually gives the most meaningful figure.
A beta checklist
- What period, frequency and benchmark were used?
- Has the business changed since the period measured?
- How does beta compare with the stock’s total volatility?
- What is the combined beta-weighted exposure of all positions?
- Is a large market event, such as a central bank decision, coming up?
Answering these keeps beta in its proper place as one input, not a complete risk measure.
Frequently asked questions
What is a good beta?
There is no good or bad beta; it depends on what you want. Higher beta means more sensitivity to the market in both directions.
Why do different websites show different betas?
Because they use different time periods, return frequencies and benchmark indices. Checking how a beta was calculated matters before relying on it.
Leverage, margin and cost figures in this article are example values for illustration. Actual terms depend on the provider, the instrument and the rules in your country.
This article is educational content and does not constitute financial, investment, legal or tax advice. Digital assets are volatile and you may lose the amount you invest.