
What Is the VIX and Why Is It Called the Fear Index?
The VIX measures expected S&P 500 volatility over 30 days from option prices. Why it spikes in sell-offs, its 82.69 record in 2020 and how to read its levels.
The VIX, or Cboe Volatility Index, measures how much the market expects the S&P 500 to move over the next 30 days, using S&P 500 option prices. It is the “fear index” because worried investors pay more for protective options, pushing it up. Its record close was 82.69 on March 16, 2020, when the S&P 500 fell almost 12%.
How it works
The VIX is derived from prices of a wide range of S&P 500 options and expressed as an annualized percentage. A VIX of 20 implies expected annual moves of about 20%, or roughly 20 ÷ √12 ≈ 5.8% over a month. It does not predict direction, only the expected size of moves.
What VIX levels imply, illustrated
| VIX | Expected one-month move (about one standard deviation) | Expected one-day move |
|---|---|---|
| 15 | About 4.3% | About 0.9% |
| 20 | About 5.8% | About 1.3% |
| 30 | About 8.7% | About 1.9% |
| 40 | About 11.5% | About 2.5% |
(Approximate conversions: monthly ≈ VIX ÷ √12; daily ≈ VIX ÷ √252.) Moves larger than these occur regularly, because market returns have fatter tails than a normal distribution.
Typical levels
- Average: about 19.5 from 1990 to early 2022.
- Calm markets: below 15; it touched lows near 9 in 2017–2018.
- Stress: above 30.
- Crises: 89.53 intraday in October 2008; 82.69 close in March 2020.
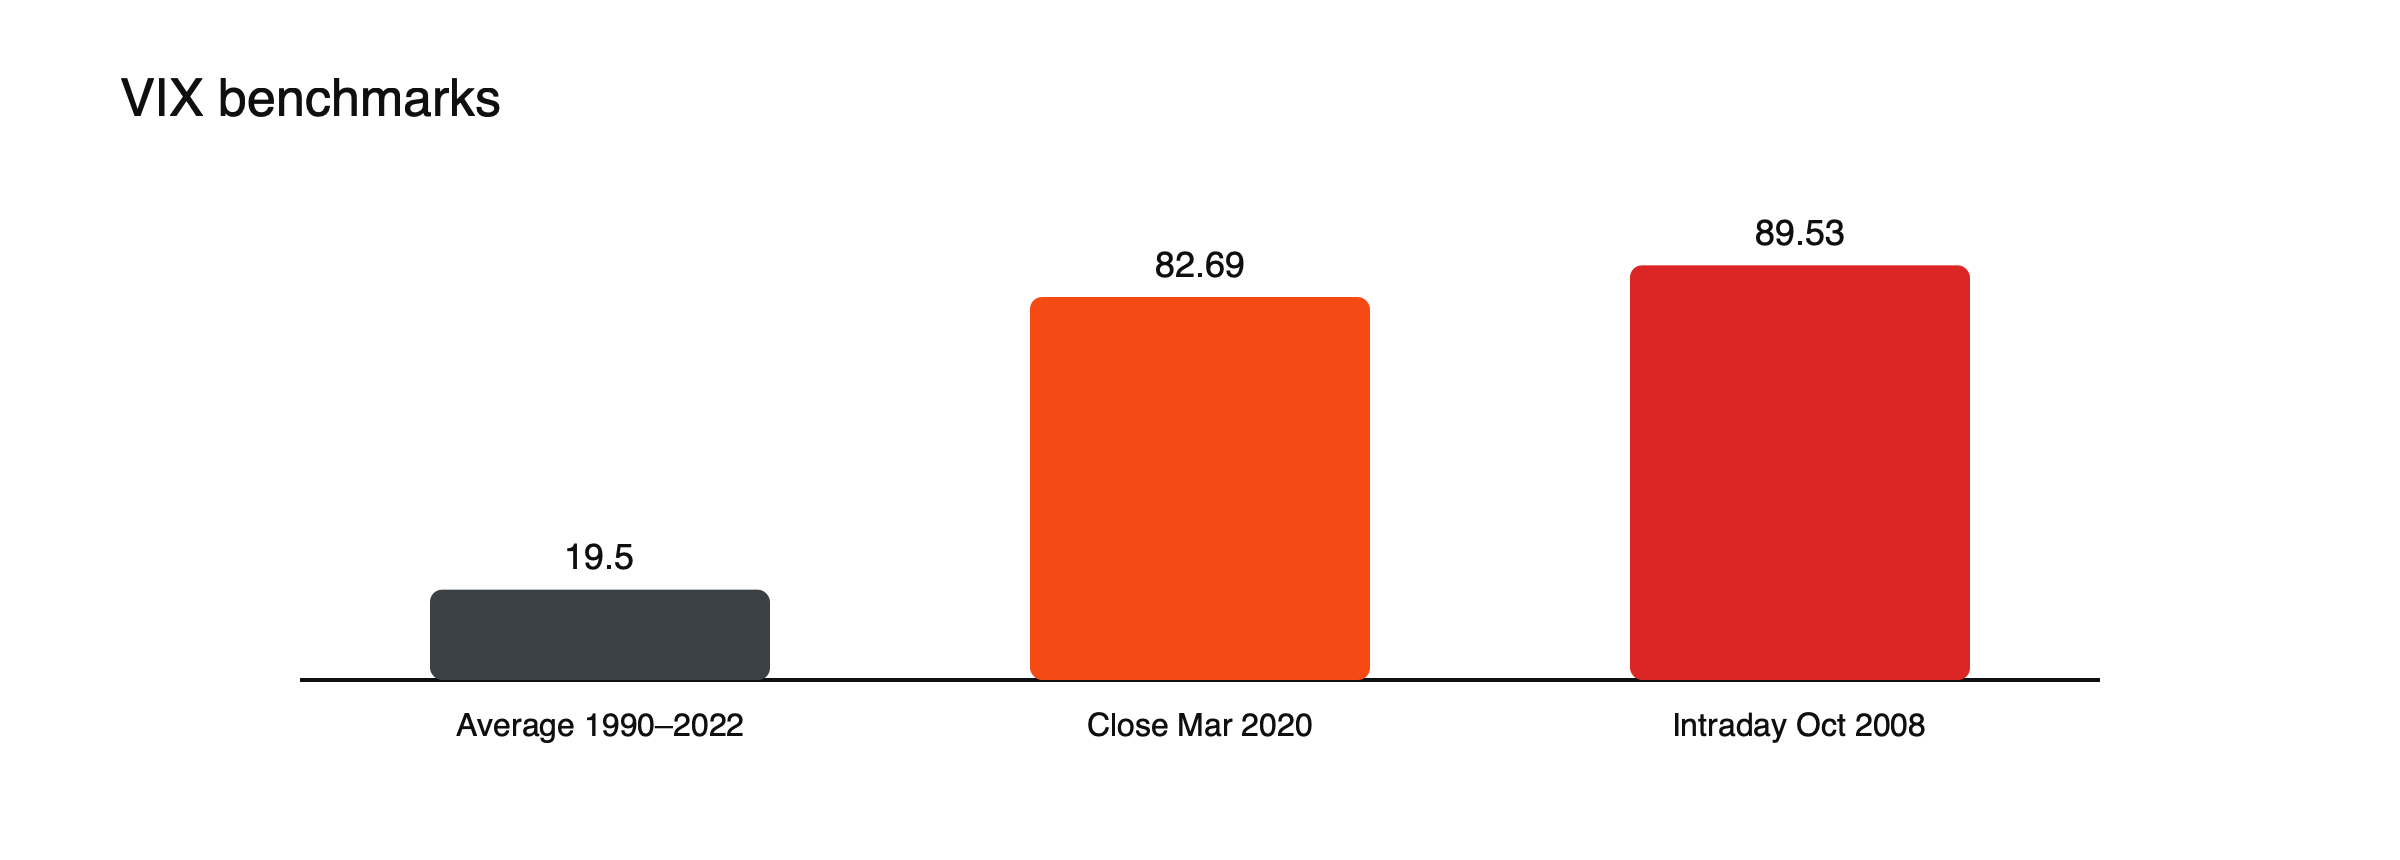
Figure: VIX benchmarks. Sources: John Hancock; Datahub.
Why it spikes. When stocks fall sharply, investors rush to buy put options as insurance, and option prices, and the VIX, jump. The VIX often rises when stocks fall and falls when they rise.
Spikes in practice
On March 16, 2020, as the pandemic hit markets, the S&P 500 fell almost 12% and the VIX closed at a record 82.69. On August 5, 2024, during the yen carry trade unwind, the VIX briefly jumped to around 65 in early trading before falling back within days. Spikes of this kind are often short-lived: the VIX tends to fall back toward its average once the immediate panic passes, which is why it is described as mean-reverting.
How it is traded
You cannot buy the VIX itself; traders use VIX futures, options and exchange-traded products, whose prices can differ widely from the spot index. Some providers offer CFDs on VIX futures. See mistakes traders make when reading the VIX.
VIX futures and the curve
VIX futures reflect expected volatility at future dates. In calm markets, longer-dated futures usually trade above the spot VIX, a contango, because investors expect volatility to rise from low levels over time. In panics, the curve inverts, with near-dated futures above later ones. Products that hold VIX futures and roll them lose value steadily in contango, which is why long-volatility products tend to decline over time unless a spike arrives. See what contango and backwardation are.
When betting against volatility goes wrong
Products that profit from falling volatility became popular during the calm of 2017. In February 2018, a sudden jump in the VIX wiped out much of their value in a single day, an episode known as Volmageddon. It showed how strategies that earn small, steady gains from calm markets can lose heavily when volatility returns.
See what Volmageddon was, why volatility in one market spills into others and what moves stock market indices.
Using the VIX for sizing
Because the VIX estimates expected moves, it can guide position sizes on index CFDs. With the VIX at 20, an S&P 500 position might expect daily moves of about 1.3%; at 40, about 2.5%. A trader keeping risk constant might halve index exposure when the VIX doubles. With $2 per point on a US index near 5,000, a 1.3% move is about $130; at a VIX of 40, the same position’s typical daily swing roughly doubles. (Illustrative figures.) See how to size a CFD position using risk per trade.
Other volatility indices
Similar indices exist for other markets: the VSTOXX for the EURO STOXX 50, the VXN for the Nasdaq 100 and the MOVE index for US Treasury bond volatility. They tend to rise together in global sell-offs, but differences between them can show where stress is concentrated, for example in bonds rather than stocks.
The VIX and the direction of stocks
The VIX usually moves in the opposite direction to the S&P 500: it rises when stocks fall and falls when they rise. That happens because investors buy protection when markets drop, and because falling markets tend to be more volatile than rising ones. The relationship is not fixed: in strong, speculative rallies, the VIX can rise alongside stocks as investors buy call options, which also lifts implied volatility.
The term structure as a signal
Comparing the spot VIX with VIX futures, or with volatility indices for longer periods, shows how investors expect volatility to evolve. When near-term expected volatility rises above longer-term expectations, an inverted term structure, markets are under acute stress. When it returns to normal, the panic is usually easing. Traders watch the shape of the curve as closely as the level.
Low volatility and complacency
Long periods of very low VIX readings can encourage larger positions and strategies that rely on calm continuing. When volatility then jumps, as in February 2018, those positions can unwind quickly, adding to the move. A low VIX means calm is expected, not guaranteed.
Common misreadings
- Treating the VIX as a forecast of direction.
- Assuming VIX products track the spot VIX.
- Selling volatility because it looks high, without sizing for further spikes.
Implied and realized volatility
The VIX measures implied volatility, the volatility priced into options. Realized volatility is how much the index actually moved. Implied volatility is usually somewhat higher than realized volatility, because investors pay a premium for protection. When realized volatility jumps above implied, markets are moving more than expected, often during sudden sell-offs; when implied stays well above realized for long, options are expensive relative to actual moves.
The VIX and other markets
VIX spikes often coincide with moves in other markets: government bonds rally, the yen and Swiss franc strengthen, credit spreads widen and risk-sensitive currencies weaken. Watching these together gives a fuller picture of how deep a sell-off is. See why volatility in one market spills into others.
A VIX checklist
- Is the VIX above or below its long-run average?
- Is its term structure normal or inverted?
- How does realized volatility compare?
- Are major events, such as central bank decisions, scheduled?
- Have index position sizes been adjusted for current volatility?
Trading volatility through CFDs
Some providers offer CFDs on VIX futures. Their prices follow the futures, not the spot VIX, and they are rolled at each expiry, so in calm periods with contango the roll steadily erodes long positions. Prices can gap sharply when volatility spikes, often far beyond stops, and margin requirements are usually higher than on stock indices. Long volatility positions suit short-term hedges around specific events; short positions can lose very heavily in a sudden spike. Sizing for an extreme move, rather than a typical one, is essential.
Volatility around events
The VIX often rises in the days before major scheduled events, such as central bank decisions or elections, and falls back once they pass. Traders who understand this pattern avoid reading every pre-event rise as a sign of looming trouble.
Frequently asked questions
Does a high VIX mean stocks will fall?
Not necessarily. A high VIX means large moves are expected; it often occurs after stocks have already fallen, and markets have sometimes rebounded strongly from periods of very high volatility.
Can I trade the VIX directly?
No. The index itself cannot be bought; traders use VIX futures, options and related products, whose prices often differ from the spot VIX.
Leverage, margin and cost figures in this article are example values for illustration. Actual terms depend on the provider, the instrument and the rules in your country.
This article is educational content and does not constitute financial, investment, legal or tax advice. Digital assets are volatile and you may lose the amount you invest.
Sources
- The fear gauge: what the VIX tells us (derived from S&P 500 options; expected 30-day moves; record close 82.69 on March 16, 2020; 89.53 intraday in October 2008; lows near 9 in 2017–2018) — Datahub
- What investors need to know about volatility and the VIX (average close 19.5 from 1990 to March 2022; S&P 500 −11.98% on March 16, 2020) — John Hancock Investment Management
- Volatility vs stock returns (VIX peak close 82.69 on March 16, 2020; 30-day measure from S&P 500 options) — First Trust, March 2020
- Yen carry trade unwind: 2024 episode (VIX briefly 65 on August 5) — Lambda Finance, 2026