
Why Correlations Go to One in a Crisis
In market panics, assets that usually move independently fall together. Why correlations rise in a crisis, examples from 2008 and 2020, what still diversifies.

Correlations in a crisis tend to “go to one”: assets that usually move independently start falling together. Investors sell whatever they can to raise cash or cut risk, and leveraged positions are forced closed. In 2007–2008, correlations between many asset classes jumped; in March 2020, even gold and bitcoin fell with stocks during the dash for cash.
Why it happens
- Forced selling: margin calls and redemptions force sales of liquid assets, regardless of their outlook.
- The same investors: large funds own many asset classes and cut all of them at once.
- A single driver: in a crisis, one fear dominates every market.
- Liquidity: buyers step back, so prices fall further across the board.
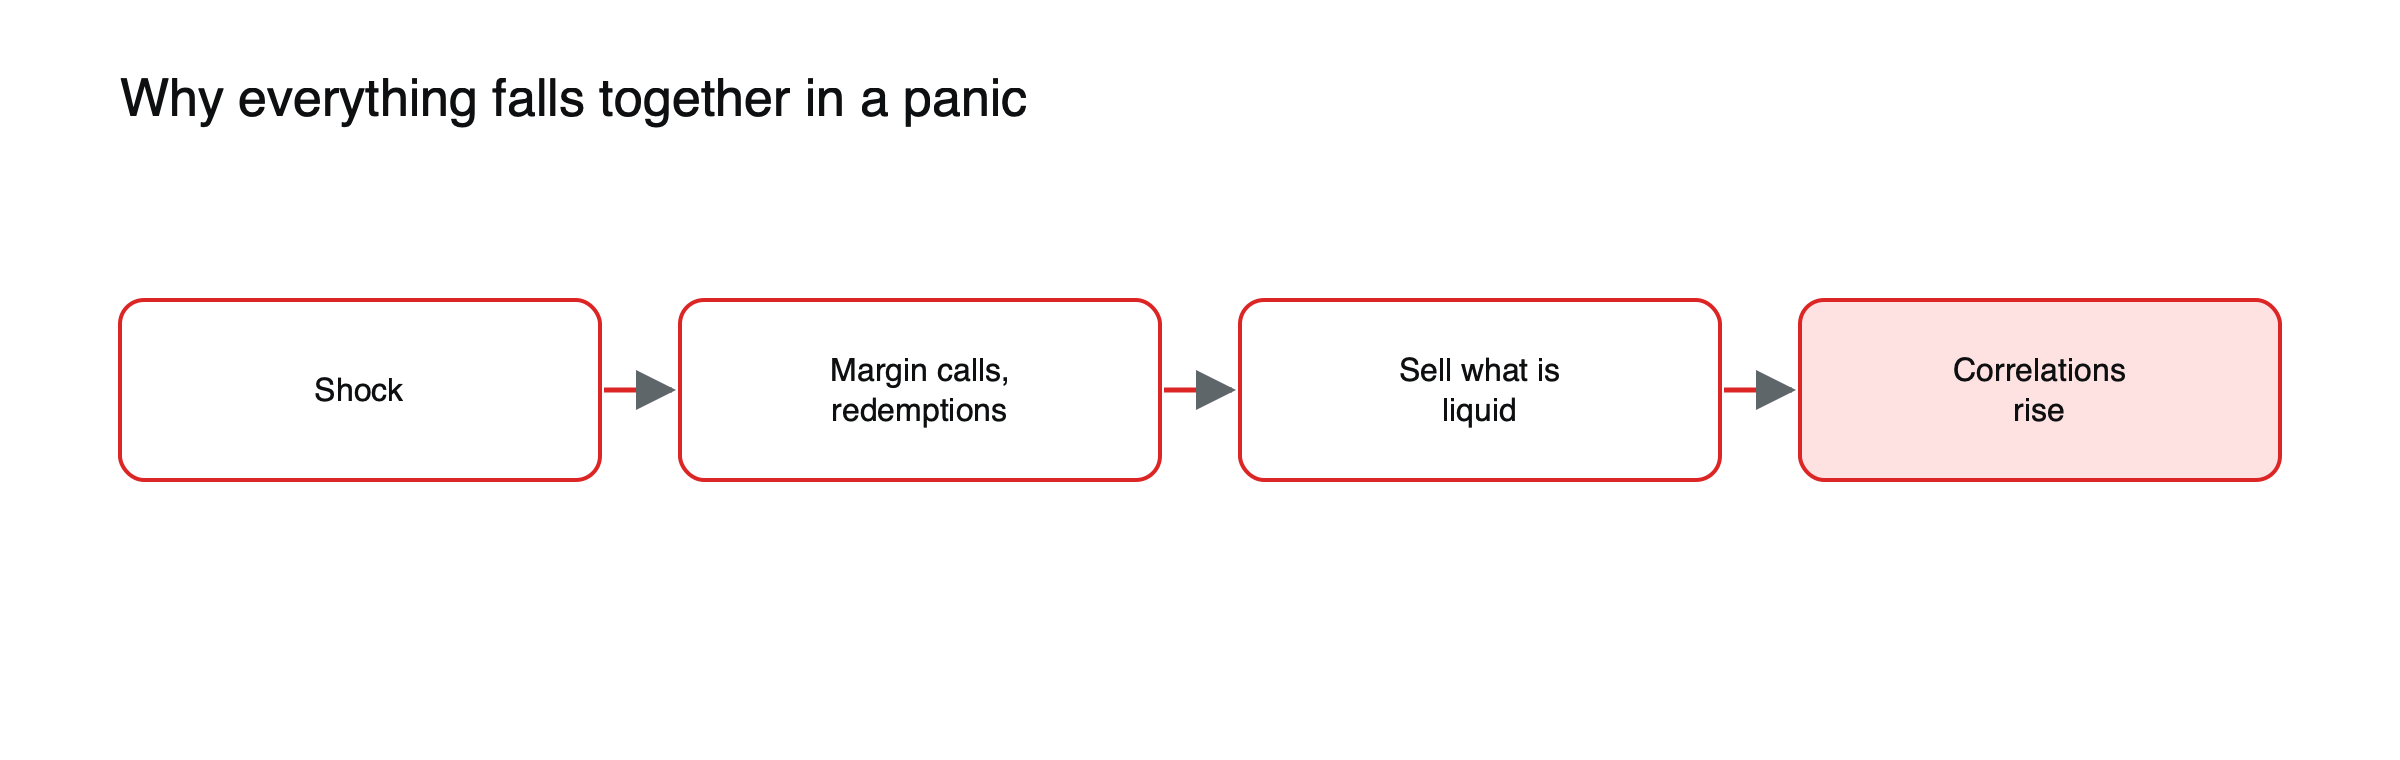
Figure: How forced selling pushes correlations toward one.
A forced sale, illustrated
Suppose a leveraged fund holds shares, corporate bonds, gold and crypto, financed with borrowing. (Illustrative scenario.) Shares fall 15% in a week, and the fund’s lenders demand more collateral. The fund cannot easily sell the shares that have fallen most without locking in losses, so it sells whatever is liquid and still holds value: gold, Treasuries, even its best-performing positions. Those assets fall too, not because their outlook changed, but because they were sellable. Repeated across many funds, this is how correlations jump in a crisis.
2008
As the crisis spread, correlations among stocks, credit and alternative assets rose sharply. Government bonds were the main exception: Treasuries gained about 20% that year.
March 2020
Bitcoin’s correlation with stocks, near zero before, spiked during the crash; gold fell about 15% in five sessions; even Treasury yields jumped briefly as investors sold safe assets for cash.
August 2024
A yen-funded carry trade unwind hit stocks in Japan, Europe and the US, and crypto, within a day. See why the yen rallies when global markets sell off.
Measuring the jump, illustrated
Correlation runs from −1, perfectly opposite, to +1, perfectly together. Suppose shares and bitcoin normally have a correlation of about 0.1, little connection. (Illustrative figures.) In a week of panic selling, it might jump to 0.7 or higher as both are sold for cash. A portfolio built on the assumption of a 0.1 correlation would lose far more than expected in that week. Correlations measured in calm times understate the risk of holding several risky assets together.
What still tends to diversify
High-quality government bonds in growth scares, cash, and sometimes the US dollar and gold over longer windows. Diversification works best over months and years, not in the worst days. See Bitcoin, gold and the dollar under market stress.
What it means
Plan for diversification to fail briefly in a crash: keep leverage low and enough cash to avoid forced selling. See why volatility in one market spills into others , what 2022 taught investors about diversification and why the stock-bond correlation flipped after 2021.
Why calm-period diversification misleads
Most risk models estimate correlations from recent history, which is mostly calm. They therefore suggest that a mix of shares, corporate bonds, commodities and alternative assets is well diversified. In a crisis, those assets often turn out to share one dominant risk: the need for liquidity. Stress-testing a portfolio with crisis correlations, rather than average ones, gives a more realistic picture of potential losses.
Inflation shocks are different
In 2022, the problem was not a dash for cash but inflation. Shares and bonds fell together for most of the year because rising rates hurt both, a different kind of correlation breakdown that lasted months rather than days. Commodities were the main diversifier that year. See what 2022 taught investors about diversification.
Practical defenses
Keeping leverage low means not being forced to sell at the worst moment. Holding some cash and high-quality government bonds provides liquidity when it is needed. Sizing positions with crisis correlations in mind, and adding up exposure across assets that tend to fall together, avoids discovering hidden concentration in a crash. See stock-bond correlation explained.
After the crisis
Correlations usually fall back once forced selling ends and central banks restore liquidity. Assets then separate again according to their own fundamentals, often in sharp rebounds. Investors who were forced to sell in the panic miss those rebounds, which is why avoiding forced selling matters more than predicting the crisis.
Stocks and bonds over time
For about two decades before 2022, shares and high-quality government bonds tended to move in opposite directions, because inflation was low and stable and the main threat to markets was weak growth. When inflation returned as the main risk, the relationship flipped, and both fell together. The sign of the stock-bond correlation depends on whether growth or inflation dominates investors’ fears. See stock-bond correlation explained.
Crypto’s changing correlations
In its early years, bitcoin moved largely independently of traditional markets. As institutional and leveraged investors entered, its correlation with technology shares rose, especially in sell-offs. In crises driven by liquidity, crypto has tended to fall with shares, often by more, undermining its appeal as a diversifier when it is needed most. See Bitcoin, gold and the dollar under market stress.
Commodities in crises
Commodities behave differently depending on the crisis. In demand-driven crashes, such as 2008 and 2020, oil and industrial metals fell sharply with shares. In supply-driven shocks, such as energy disruptions, commodities can rise while shares fall. Their diversifying value depends on the nature of the shock.
The dollar as a diversifier
In global crises, the dollar has often strengthened as investors and borrowers scramble for dollars, making it one of the more reliable diversifiers for non-US investors. For US investors, holding some foreign currency assets has sometimes added to losses in such periods.
Common misreadings
- Treating average correlations as reliable in a crash.
- Assuming every asset labeled a haven will hold up.
March 2020, step by step
In late February 2020, shares began falling while Treasuries rallied, a normal growth scare. By mid-March, the selling turned into a dash for cash: gold fell about 15% in five sessions, Treasury yields jumped despite falling shares, and bitcoin’s correlation with shares spiked. Once the Federal Reserve launched massive support on March 23, correlations fell back, and assets began to recover on their own merits. The sequence shows the difference between an ordinary sell-off and a liquidity crisis.
Volatility and correlation
Correlations and volatility tend to rise together. When the VIX jumps, the share of stocks moving in the same direction rises, and cross-asset correlations climb too. Rising volatility is therefore a warning that diversification may be about to weaken. See what the VIX is.
A crisis-aware portfolio, illustrated
Suppose a portfolio holds 50% shares, 20% corporate bonds, 10% commodities, 10% crypto and 10% cash. (Illustrative mix, not a recommendation.) In a liquidity crisis, the first four could fall together, and only the cash holds its value. Replacing part of the corporate bonds and crypto with high-quality government bonds and keeping leverage at zero would leave more of the portfolio able to hold up in the worst days, at the cost of some return in calm periods. The trade-off is between steady returns in good times and resilience in bad ones.
Correlations inside the stock market
Even within stock markets, correlations rise in crises: most shares fall together regardless of sector or quality. Defensive sectors still usually fall less, but they rarely rise in the worst days. Stock-picking offers little protection in a broad panic.
Liquidity as the hidden factor
The common thread in crisis correlations is liquidity: when investors need cash, they sell what they can, not what they want to. Assets that are easy to sell, such as gold, large shares and government bonds, often fall early in a panic for that reason, even if their long-term outlook is sound. Selling what is liquid first is rational for each investor, but collectively it rapidly spreads the panic across markets.
Frequently asked questions
Does diversification still work?
Yes, over months and years. It is least reliable in the worst days of a crisis, when correlations jump.
Which assets kept their diversifying role in 2008?
High-quality government bonds, especially US Treasuries, which gained about 20% that year.
This article is educational content and does not constitute financial, investment, legal or tax advice. Digital assets are volatile and you may lose the amount you invest.
Sources
- VIX futures and options (correlations between equities, bonds and alternatives rose significantly in 2007–2008) — ASX / UMass research paper
- Bitcoin vs equities (correlations increased in the mid-March 2020 flight to cash; gold also affected) — Xetra research note, June 2020
- Stock-Bond Return Correlation Flips Positive (2008 bonds +20.1%) — Voronoi
- March 2020 review (gold gave back nearly 15% over five sessions) — Nasdaq