
Why Crypto and Tech Stocks Often Trade as the Same Risk Asset
Crypto and tech stocks can move together when rates, liquidity and risk appetite dominate. See what strengthens the link and when it breaks.
The crypto and tech stocks correlation is strongest when the same macro forces dominate both markets: interest-rate expectations, liquidity and investor appetite for long-duration growth. The relationship is not permanent. Correlation tends to rise during broad risk-on or risk-off episodes and can break quickly when crypto-specific or company-specific news takes control.
The strongest connection is sensitivity to discount rates
Technology companies are often valued on cash flows expected far into the future. When interest rates rise, the present value of those distant cash flows falls more sharply than the value of nearer-term cash flows, all else equal.
Crypto assets do not have the same valuation model, but many trade as high-duration speculative assets. Their prices can be highly sensitive to the amount of capital investors are willing to allocate to risky, non-cash-flow or early-stage opportunities.
That creates a common macro response. Falling real yields and easier financial conditions can support both. Rapid tightening can pressure both.
Liquidity is the second common driver
When cash is cheap and financial conditions are loose, investors can take more duration and more volatility. Venture capital, unprofitable growth stocks, smaller technology companies and crypto can all benefit from the same expansion in risk budgets.
When liquidity contracts, the process can reverse at the same time. Investors reduce gross exposure, raise cash and move toward assets with shorter-duration cash flows or lower volatility.
This does not require investors to believe Bitcoin and a software company are economically identical. They only need to sit in the same part of the portfolio’s risk hierarchy.
Institutional participation made the connection easier to transmit
The crypto market used to be more isolated from traditional finance. That has changed.
The IMF documented rising spillovers between crypto assets and equity markets after the onset of the COVID-19 pandemic. A 2022 IMF analysis found that Bitcoin’s volatility and return spillovers to major equity indices had increased materially compared with the pre-pandemic period. A later IMF working paper found that return and volatility spillovers between crypto and financial assets rise during periods of market turbulence.
As the investor base overlaps more, a macro shock can reach both markets through the same funds, risk models and collateral constraints.
2022 was the clearest recent example
The Federal Reserve tightened policy aggressively in 2022 as inflation stayed high. Real and nominal yields rose, financial conditions tightened and speculative assets repriced.
The S&P 500 entered a bear market during the year, with growth and technology shares under heavy pressure. Bitcoin and the broader crypto market also fell sharply. The IMF’s spillover research identifies 2022 as a period in which risk assets and crypto were increasingly interconnected, even though crypto also suffered its own shocks, including the collapse of FTX later that year.
The important point is not that the two markets fell by the same amount. They did not. It is that a common macro shock pushed the direction of both markets before asset-specific news determined the size of the move.
Ranked: the forces that make the correlation stronger
1. Real interest rates
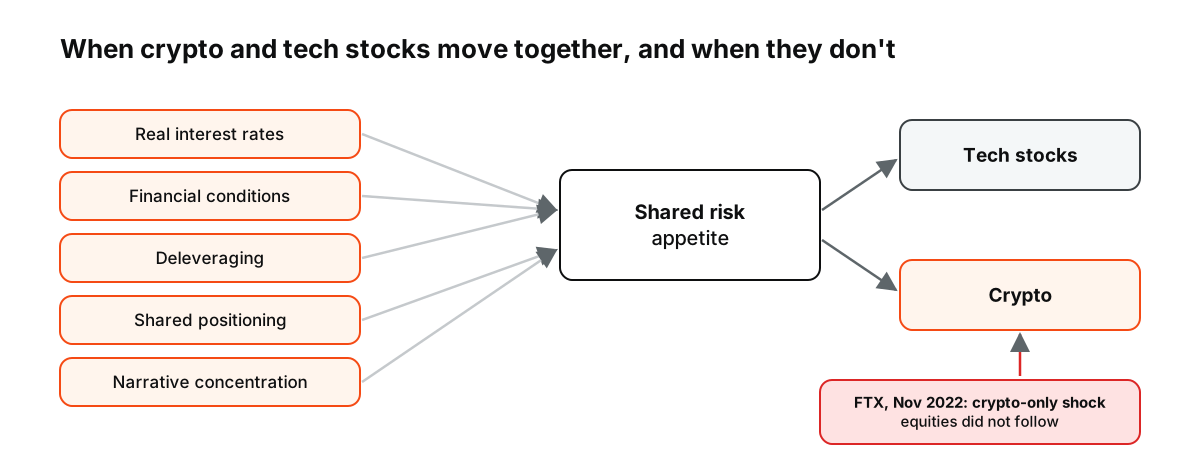
Figure: Why the two markets often move together, and why the link breaks when the shock belongs to one market.
Higher real yields increase the opportunity cost of holding assets whose value depends heavily on future growth or continued risk demand.
2. Broad financial conditions
Credit spreads, dollar liquidity and access to financing influence how much risk investors can carry.
3. Volatility targeting and deleveraging
When volatility jumps, funds can reduce exposure across several asset classes at once. That can increase correlations precisely when diversification is most needed.
4. Shared investor positioning
The more institutions and active traders hold both crypto and growth equities, the easier it becomes for one risk-off decision to affect both markets.
5. Narrative concentration
Periods dominated by a single story, such as abundant liquidity, AI enthusiasm or aggressive monetary tightening, can make different assets trade on the same headline.
The relationship breaks when the shock belongs to one market
Crypto can decouple because of exchange failures, protocol incidents, regulatory news, token-specific events or changes in market structure.
Technology stocks can decouple because of earnings, semiconductor cycles, antitrust action, capital spending or company-specific guidance.
A simple example is FTX in November 2022. Crypto volatility rose sharply because of an event inside the crypto market. Equity markets did not need an equivalent move because the underlying shock was different.
The same logic works in the other direction. A weak earnings report from a mega-cap technology company can hit the Nasdaq without changing Bitcoin’s network or crypto market structure.
What to watch when both markets start moving together
The correlation itself is less useful than the reason behind it. Watch:
- real Treasury yields;
- the US dollar;
- equity volatility;
- credit spreads;
- central-bank expectations;
- crypto-specific funding, liquidations and exchange stress;
- earnings revisions in technology.
If the macro variables dominate, crypto and tech can trade like neighboring versions of the same risk position. If the shock is local, the relationship can disappear quickly.
Measuring the correlation, illustrated
Traders often measure the relationship with a rolling correlation of daily returns over 30 or 90 days. Suppose bitcoin’s 90-day correlation with the Nasdaq 100 is 0.6 during a period dominated by interest rate news, then falls to 0.1 a few months later after a crypto-specific event. (Illustrative figures.) The first reading suggests a shared driver; the second shows the link has weakened. A single number says little without the period and the reason behind it.
October 2025
The crypto crash of October 10, 2025, when more than $19 billion of leveraged positions were wiped out, showed how crypto-specific leverage can drive moves far larger than anything in technology shares. Liquidations on crypto exchanges, not a change in interest rate expectations, explained most of the fall, which is the kind of local shock that weakens the correlation.
Exchange-traded funds and the link
The launch of spot bitcoin exchange-traded funds in the United States in January 2024 made it easier for traditional investors to hold bitcoin alongside shares in the same accounts. Wider institutional ownership can strengthen the link between crypto and equities during broad risk-on or risk-off moves, because the same investors adjust both. See bitcoin CFDs vs bitcoin ETFs.
What it means for diversification
Investors sometimes hold crypto expecting it to diversify a portfolio of technology shares. In periods dominated by interest rates and liquidity, that diversification can largely disappear, with both falling together. It tends to reappear when news specific to one market dominates. Diversification that depends on the source of the next shock is less reliable than it looks.
Holding both as a trader
A trader holding long CFDs on both a technology index and bitcoin may effectively hold one larger bet on falling rates and rising risk appetite. Adding up the exposure, and sizing for the possibility that both fall together, avoids taking more risk than intended. See what moves the bitcoin price and what a crypto CFD is.
Stablecoins and liquidity
The supply of dollar-linked stablecoins is sometimes used as a measure of liquidity inside crypto markets: growing supply suggests more money available to buy crypto assets, while shrinking supply suggests money leaving. Changes in stablecoin supply can drive crypto prices independently of equity markets, which is one reason the correlation with technology shares varies. See what a stablecoin is.
Measurement problems
Crypto trades every day, while stock markets close at night and at weekends. Correlations calculated from daily closing prices can therefore miss moves that happen while stock markets are shut, or attribute them to the wrong day. Large weekend moves in crypto, followed by equity reactions on Monday, can make the link look weaker or stronger than it is. Using matching time windows gives a more reliable picture, but no single method is perfect.
A cross-asset checklist
- Are real yields and the dollar moving sharply?
- Is the news macro or specific to crypto or one company?
- What does a rolling correlation over a matching window show?
- How large is combined exposure to crypto and technology?
- Are crypto liquidations or funding stress building?
Working through these before adding a position in either market keeps the shared risk visible. Correlations shift quickly, so this check is most useful when repeated every few weeks rather than done once.
Frequently asked questions
Is bitcoin a technology stock?
No. It has no earnings or cash flows, but in some periods it has traded as if it were a very volatile growth asset.
Does the correlation stay high?
No. It rises during broad macro moves and falls when crypto-specific or company-specific events dominate.
This article is educational content and does not constitute financial, investment, legal or tax advice. Digital assets are volatile and you may lose the amount you invest.
Sources
- Cryptic Connections: Spillovers between Crypto and Equity Markets — IMF, January 2022
- New Evidence on Spillovers Between Crypto Assets and Financial Markets — IMF Working Paper 2023/213
- DeFi TVL drops 39% in 2026 (October 10, 2025 crash erased more than $19 billion in leveraged positions) — Cointelegraph, June 2026