
How Bitcoin CFD Prices Track the Spot Market
A bitcoin CFD price comes from the provider's feed, usually based on major exchanges, plus a spread. Why CFD and exchange prices can differ and what that means.
Bitcoin CFD prices track the spot market through the provider’s feed, usually built from major exchanges or liquidity providers, with a bid and ask quoted around it. The spread is part of your cost. Bitcoin trades on many venues at once, so a CFD can differ slightly from any single exchange, especially in fast markets.
Where the price comes from
- Exchange prices: a single venue or an average of several.
- Liquidity providers: firms quoting prices based on their own trading.
- The spread: added around the reference, wider when markets are volatile or thin.
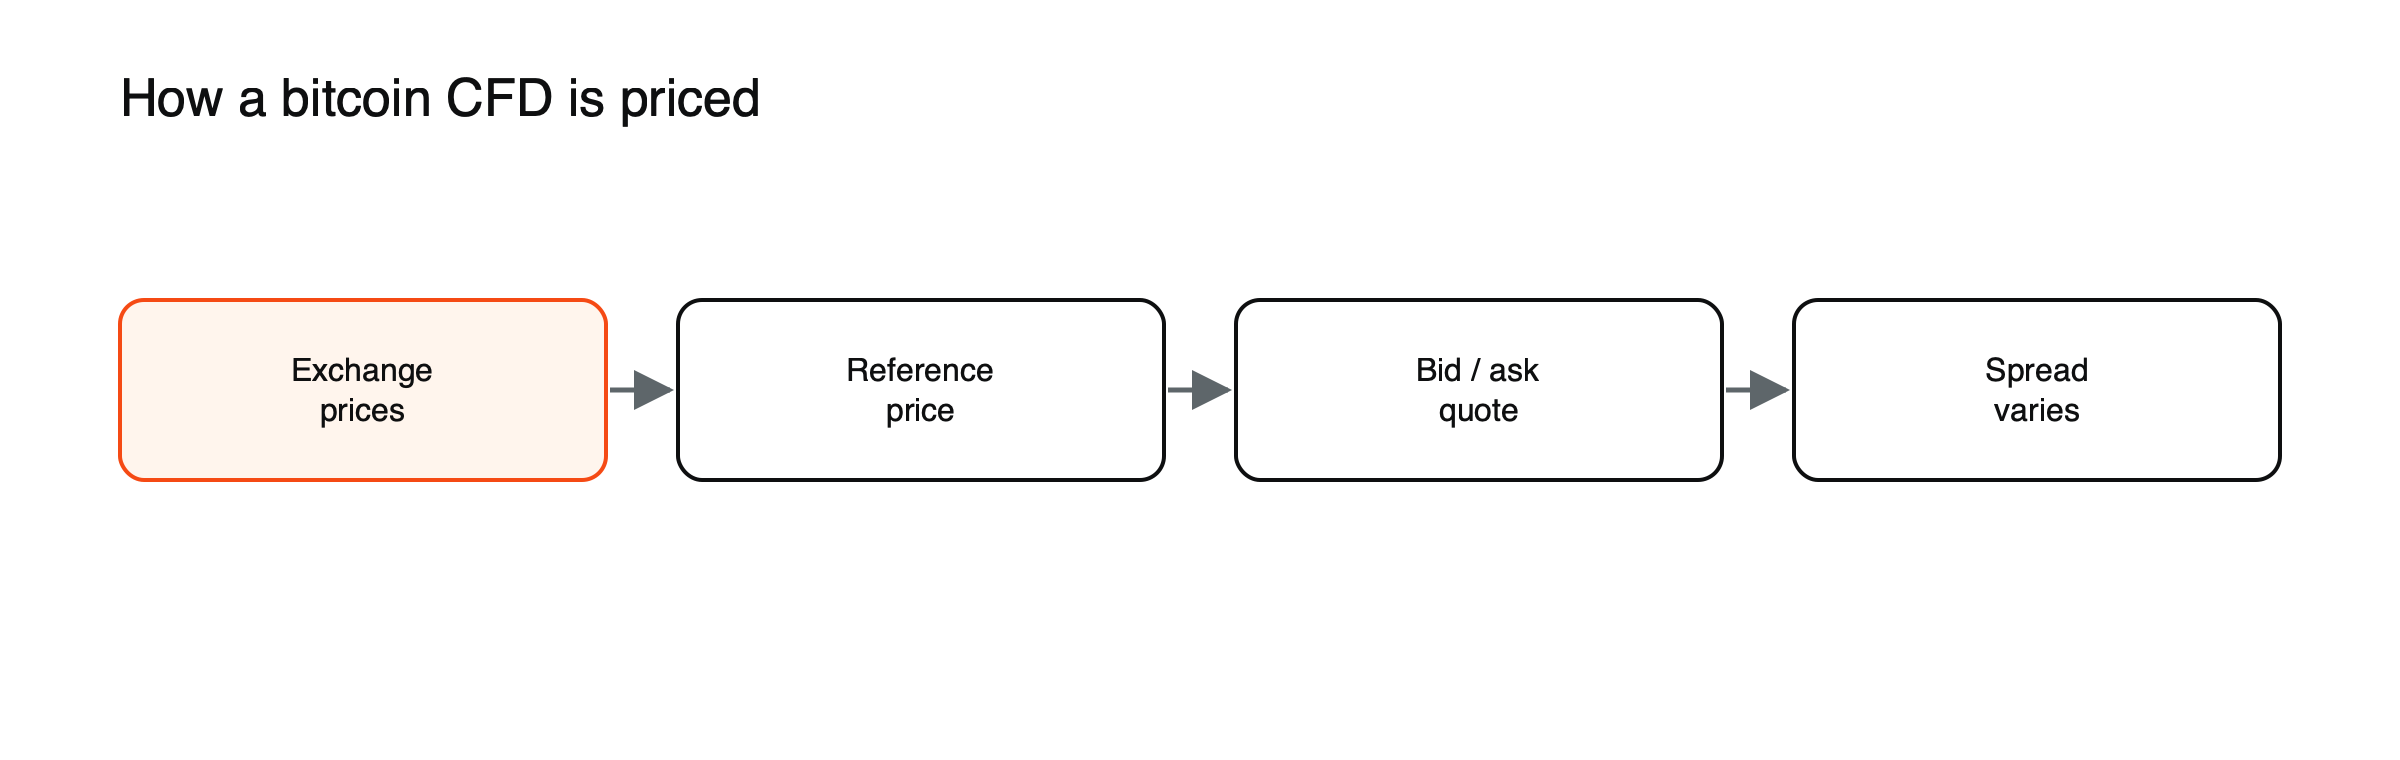
Figure: From exchange prices to a CFD quote.
See how CFD prices track the underlying market.
Bid, ask and mid, illustrated
Suppose the provider’s reference price for bitcoin is $60,000 and it quotes a spread of $60: bid $59,970, ask $60,030. (Illustrative figures.) A buyer pays $60,030 and could immediately sell only at $59,970, so a new position starts about $60 per coin, or 0.1%, behind. On 0.1 BTC, that is $6. In a fast market, the same provider might widen the spread to $200 or more, raising the cost of entering or exiting at that moment.
Index pricing versus a single exchange
Some providers base prices on a single large exchange; others use an index that averages prices from several venues, sometimes excluding outliers. An index is harder to distort and less exposed to problems at one exchange, but it may lag the fastest venue by a fraction of a second. A single-exchange feed may be faster but inherits that exchange’s outages and quirks.
Why prices differ between venues
Bitcoin has no single official exchange. Liquidity, demand from local investors and withdrawal limits can create small differences, which arbitrage traders usually close quickly.
How arbitrage keeps prices close
When bitcoin trades higher on one exchange than another, traders buy on the cheaper venue and sell on the dearer one, narrowing the gap. Arbitrage works well when transfers between venues are fast and cheap, and less well when withdrawals are slow, exchanges restrict access or markets are in turmoil. That is why venue differences are usually tiny but can widen sharply in a crash.
When gaps get larger
In crashes, some exchanges lag or halt, spreads widen and prices on different venues can diverge sharply for minutes. Stop-losses may fill far from their level. See how to set stop-losses on crypto CFDs when prices gap.
October 2025
In the crypto crash of October 10, 2025, more than $19 billion of leveraged positions were wiped out, and prices diverged sharply between venues. A dollar-linked token, USDe, traded as low as $0.65 on one exchange while holding much closer to $1 elsewhere. Traders whose prices or stops depended on a single venue could see fills at levels that did not exist elsewhere. Episodes like this show why the source of a CFD’s price matters.
Weekends and maintenance
Crypto trades around the clock, but a provider’s CFD trading hours, maintenance windows and weekend spreads depend on its own rules. See what changes when you trade crypto CFDs on weekends.
What to check
Which reference your provider uses, typical spreads by time of day, and how it handles exchange outages.
See what a crypto CFD is.
Latency and slippage
Prices change many times a second in active crypto markets. Between clicking to trade and the order reaching the provider, the price may move, so the fill differs from the price on screen, known as slippage. Slippage is usually small in calm markets but can be large in fast ones, and it affects stops and market orders most. See what slippage is in crypto trading.
Weekend prices
When crypto trades through the weekend while traditional markets are closed, liquidity is often thinner, and spreads on crypto CFDs may widen. Large moves can happen on Saturday or Sunday, so positions held over weekends need margin and stops planned for that.
Spreads through the day
Even though bitcoin trades around the clock, liquidity varies. Spreads are often tightest when US and European markets are both active and wider during quieter hours, especially late on weekends and on public holidays. Many providers also widen spreads around major announcements, such as US inflation data or central bank decisions, when crypto prices can jump. Checking spreads at the times you usually trade gives a realistic picture of costs.
When exchanges go down
Exchanges sometimes suffer outages, especially in volatile markets when traffic surges. A provider using a single exchange may pause quoting or show stale prices; one using several sources can continue, perhaps with wider spreads. Knowing how your provider handles outages matters, because you may be unable to close a position when you most want to.
Why charts and fills differ
Charts often show mid prices or prices from a particular exchange, while trades are filled at the provider’s bid or ask. In fast markets, the chart may show a level that was never available to trade, or a stop may fill some distance away from the price displayed. Comparing fills with chart levels after a volatile period shows how much difference to expect.
A price-check routine
- Note the provider’s price, spread and time.
- Compare with one or two major exchanges.
- Repeat at different times, including weekends.
- Review fills on stops after volatile days.
A few checks like these reveal how closely a provider’s prices track the market and how much its spreads vary.
A weekend move, illustrated
Suppose bitcoin trades at $60,000 on Friday evening and a large holder sells heavily early on Sunday, pushing prices down 6% within an hour in thin trading. (Illustrative scenario.) A provider quoting through the weekend shows the fall and may widen its spread from $60 to $250; a stop at $57,000 could fill near $56,400. A provider that pauses weekend trading would reopen at the new level, with any stop filled at the first available price. Either way, the weekend move reaches the position.
Prices for other coins
The same principles apply to ether and smaller coins, but their markets are thinner, so differences between venues, spreads and slippage tend to be larger. A provider’s price for a small coin may rely on only one or two exchanges.
What to ask a provider
Which exchanges or indices the price is based on, how spreads change at weekends and in volatile markets, what happens during exchange outages and how clearly erroneous prices are handled. Clear, written answers to these questions are a good early sign of a transparent and reliable pricing process overall.
Frequently asked questions
Why is my CFD price different from the price on a crypto exchange?
Because the provider may use a different reference, such as an average of several exchanges, and adds its own spread.
Can a provider’s price spike when the market does not?
Rarely, but feed errors or a single exchange’s problems can cause unusual prints. Providers usually have rules for correcting clearly erroneous prices.
This article is educational content and does not constitute financial, investment, legal or tax advice. Digital assets are volatile and you may lose the amount you invest.
Sources
- ESMA adopts CFD measures (2:1 for cryptocurrencies; 50% margin close-out; negative balance protection) — Finadium
- Ethena under pressure (USDe at $0.65 on one exchange during the October 2025 crash, showing price divergence between venues) — Kaiko via Brainsum, December 2025
- DeFi TVL drops 39% in 2026 (October 10, 2025 crash erased more than $19 billion in leveraged positions) — Cointelegraph, June 2026