
How to Read an ETF Factsheet
Check the objective and index, fees, size, holdings, performance vs the index, structure and listing details: how to read an ETF factsheet, step by step.
To read an ETF factsheet, start with the objective and index, then check fees, size and launch date, top holdings and sector weights, performance against the index, replication and dividend policy, and listing details such as ticker and currency. The factsheet, usually updated monthly, summarizes what you own and what it costs.
Before you start
Download the latest factsheet and key information document from the issuer’s website.
Reading it, section by section
Objective and index
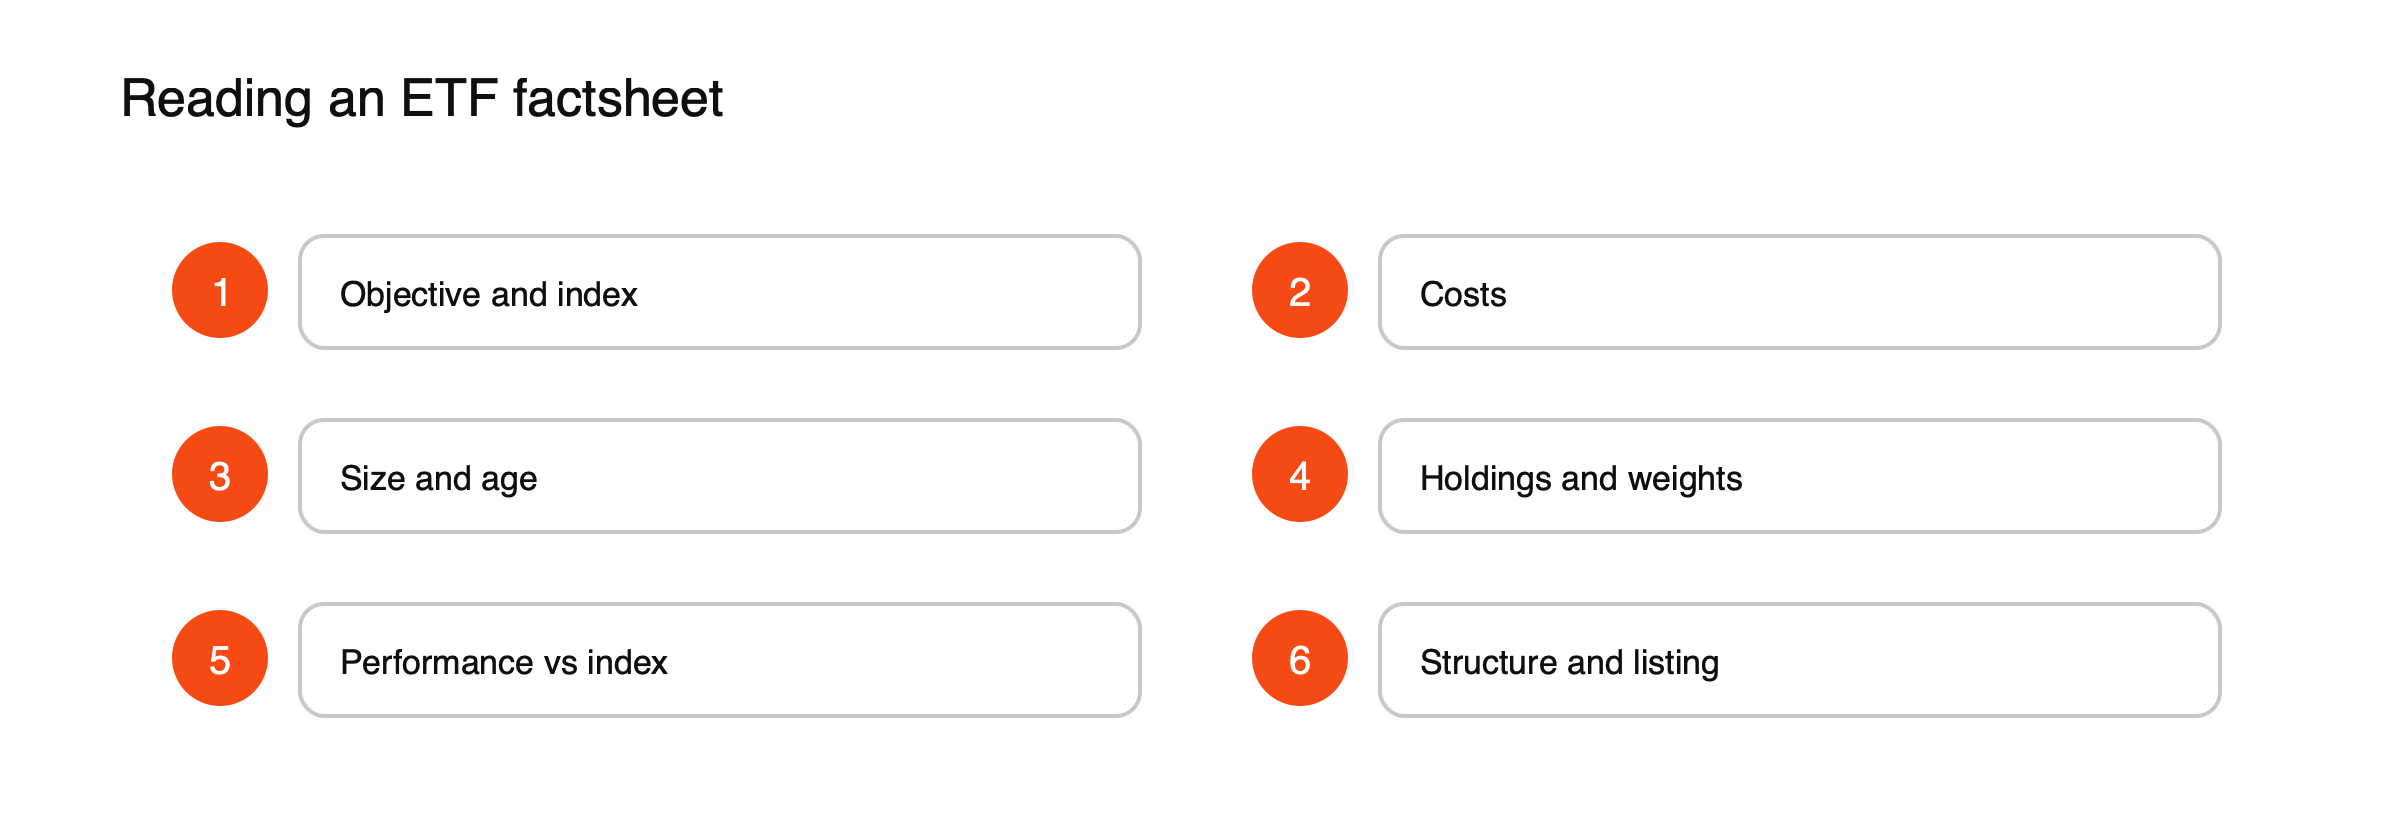
Figure: What to read on a factsheet.
What the fund tries to do and which index it follows.
Costs
Ongoing charge or expense ratio. See how much an ETF’s expense ratio costs.
Size and age
Assets under management and launch date; very small or new funds carry closure risk.
Holdings and weights
Top 10 holdings and sector or country breakdown reveal concentration. See why a handful of stocks can drive an entire index.
Performance
Fund vs index over 1, 3, 5 and 10 years shows tracking. See what tracking difference is.
Structure
Physical or synthetic, securities lending, accumulating or distributing.
Listing details
Ticker, exchange, trading currency and domicile.
A factsheet, read in practice
Here is how the key lines of a hypothetical factsheet might be interpreted. (Hypothetical fund.)
| Factsheet line | What it says | What to take from it |
|---|---|---|
| Objective | Track a global developed-market index | Broad exposure, not a theme |
| Ongoing charge | 0.12% | Low, but compare with similar funds |
| Fund size | $4 billion | Large enough to make closure unlikely |
| Launch date | 2012 | Long track record to check |
| Top 10 holdings | 22% of the fund | Moderately concentrated in large firms |
| 5-year return vs index | 9.81% vs 9.92% a year | Tracking difference about −0.11% a year |
| Replication | Physical, sampled | Holds most, not all, index members |
| Securities lending | Up to 15% of assets | Some extra income, small counterparty risk |
| Distribution | Accumulating | Income reinvested |
| Currency | USD | Currency exposure for non-dollar investors |
Key information documents
In Europe, funds also publish a key information document, a short standardized document showing risk indicators, costs and performance scenarios. It complements the factsheet and makes comparisons between funds easier because the format is the same for every fund.
Common mistakes
Reading past performance as a forecast, and overlooking concentration in the top holdings. See how to compare ETFs that track the same index and what an ETF is.
Checking concentration and overlap
The top holdings and sector breakdown show how concentrated a fund is and how much it overlaps with other funds you hold. A broad US fund and a technology fund may share many of their largest holdings; comparing their top ten lists shows how much exposure is really new.
Performance figures
Factsheets show past returns over several periods, usually alongside the index. The most useful comparison is the gap between the two, the tracking difference, over several years. Absolute past returns say more about the market than about the fund, and do not predict future results.
Risk indicators
Many factsheets include a risk rating on a numbered scale, often based on past volatility. It is a rough guide: a fund with a low rating can still fall sharply in a crisis, and ratings can change as volatility changes.
Comparing two factsheets, illustrated
| Fund A | Fund B | |
|---|---|---|
| Index | Same S&P 500 index | Same S&P 500 index |
| Ongoing charge | 0.03% | 0.09% |
| Fund size | $500 billion | $1.5 billion |
| 5-year tracking difference | −0.04% a year | −0.12% a year |
| Replication | Physical, full | Physical, full |
| Distribution | Distributing | Accumulating |
(Hypothetical funds.) Fund A is cheaper, larger and tracks more closely; Fund B’s main attraction is its accumulating share class. If tax treatment or convenience favors accumulation, Fund B may still be the better choice for a particular investor, but on cost and tracking alone, Fund A leads.
Domicile and tax
The fund’s domicile, the country where it is legally based, affects how dividends are taxed inside the fund and how the investor is taxed. Many European ETFs are domiciled in Ireland or Luxembourg; US ETFs are domiciled in the United States, and some investors outside the US cannot buy them or face different tax treatment. The factsheet states the domicile, which is worth checking against local rules.
Trading information
Some factsheets list the exchanges where the fund trades, its tickers in each and sometimes average spreads or trading volumes. A fund listed on several exchanges in different currencies can be bought in the most convenient one. Wider spreads and lower volumes suggest higher trading costs, especially for larger orders.
Warning signs
- Very small fund size, which raises the risk of closure.
- Tracking difference much larger than the fee.
- Very high concentration in a few holdings.
- A short track record for a complex strategy.
Common misreadings
- Choosing the fund with the best past return rather than the closest tracking.
- Ignoring the share class and currency details.
Beyond the factsheet
The factsheet summarizes; other documents give detail. The prospectus explains the fund’s objective, risks and rules in full. Annual and semi-annual reports show audited accounts, holdings and costs, including income from securities lending. Index providers publish methodology documents explaining how the index is built and rebalanced. For most investors, the factsheet and key information document are enough; for unusual or complex funds, the longer documents are worth reading.
Reading the performance table, illustrated
A factsheet might show the fund’s calendar-year returns next to the index’s: 2021, 28.6% against 28.7%; 2022, −18.2% against −18.1%; 2023, 26.2% against 26.3%. (Hypothetical figures.) In each year, the fund lagged by about 0.1%, roughly its fee, in both rising and falling markets. That consistency is a good sign. A fund that sometimes lags by 0.1% and sometimes by 1% deserves closer scrutiny.
Bond ETF factsheets
Factsheets for bond ETFs add measures such as average duration, which shows how sensitive the fund is to interest rate changes, yield to maturity, which indicates expected income if bonds are held to maturity, and credit quality breakdowns. A fund with a duration of seven years would be expected to fall about 7% if yields rose one percentage point. See how bonds work.
Currency-hedged share classes
Some funds offer share classes hedged into another currency. Their factsheets show the hedging approach and the performance of the hedged class against a hedged index. Comparing hedged and unhedged classes shows how much currency moves have affected returns.
A factsheet checklist
- Objective and index
- Ongoing charge
- Size and launch date
- Top holdings and sector or country weights
- Tracking difference over several years
- Replication, lending and distribution policy
- Domicile, currency and listings
How often to recheck
Reviewing the factsheets of funds you hold once a year is usually enough to spot fee changes, growing tracking differences, shifts in concentration or a shrinking fund size. A brief note of the key figures each year makes changes easy to see. If something has moved significantly, comparing the fund with alternatives tracking the same index shows whether a switch is worth its costs, including any taxes. Funds that still lead on cost and tracking rarely need replacing, however tempting a newer fund launch may look.
Frequently asked questions
How often are factsheets updated?
Usually monthly, so figures such as holdings and performance may be a few weeks old.
Where can I find the full list of holdings?
Most ETF providers publish full holdings on their websites, often daily, in more detail than the factsheet.
This article is educational content and does not constitute financial, investment, legal or tax advice. Digital assets are volatile and you may lose the amount you invest.