
How Earnings per Share Is Calculated
EPS = net income ÷ shares outstanding. A worked example shows basic EPS of $1.95 and diluted EPS of about $1.88, plus adjusted EPS and why one-off items matter.
Earnings per share (EPS) is a company’s net income divided by its number of shares: EPS = net income ÷ shares outstanding. If a company earns $97.5 million and has 50 million shares, basic EPS is $1.95. Diluted EPS also counts shares that could be created from options and convertible securities; with 52 million diluted shares, it is about $1.88.
The formulas
- Basic EPS = net income (minus preferred dividends) ÷ weighted average shares
- Diluted EPS = same income ÷ shares including options, warrants and convertibles
Worked example (ExampleCo)
- Net income: $97.5 million
- Basic shares: 50 million → basic EPS = $1.95
- Diluted shares: 52 million → diluted EPS ≈ $1.88
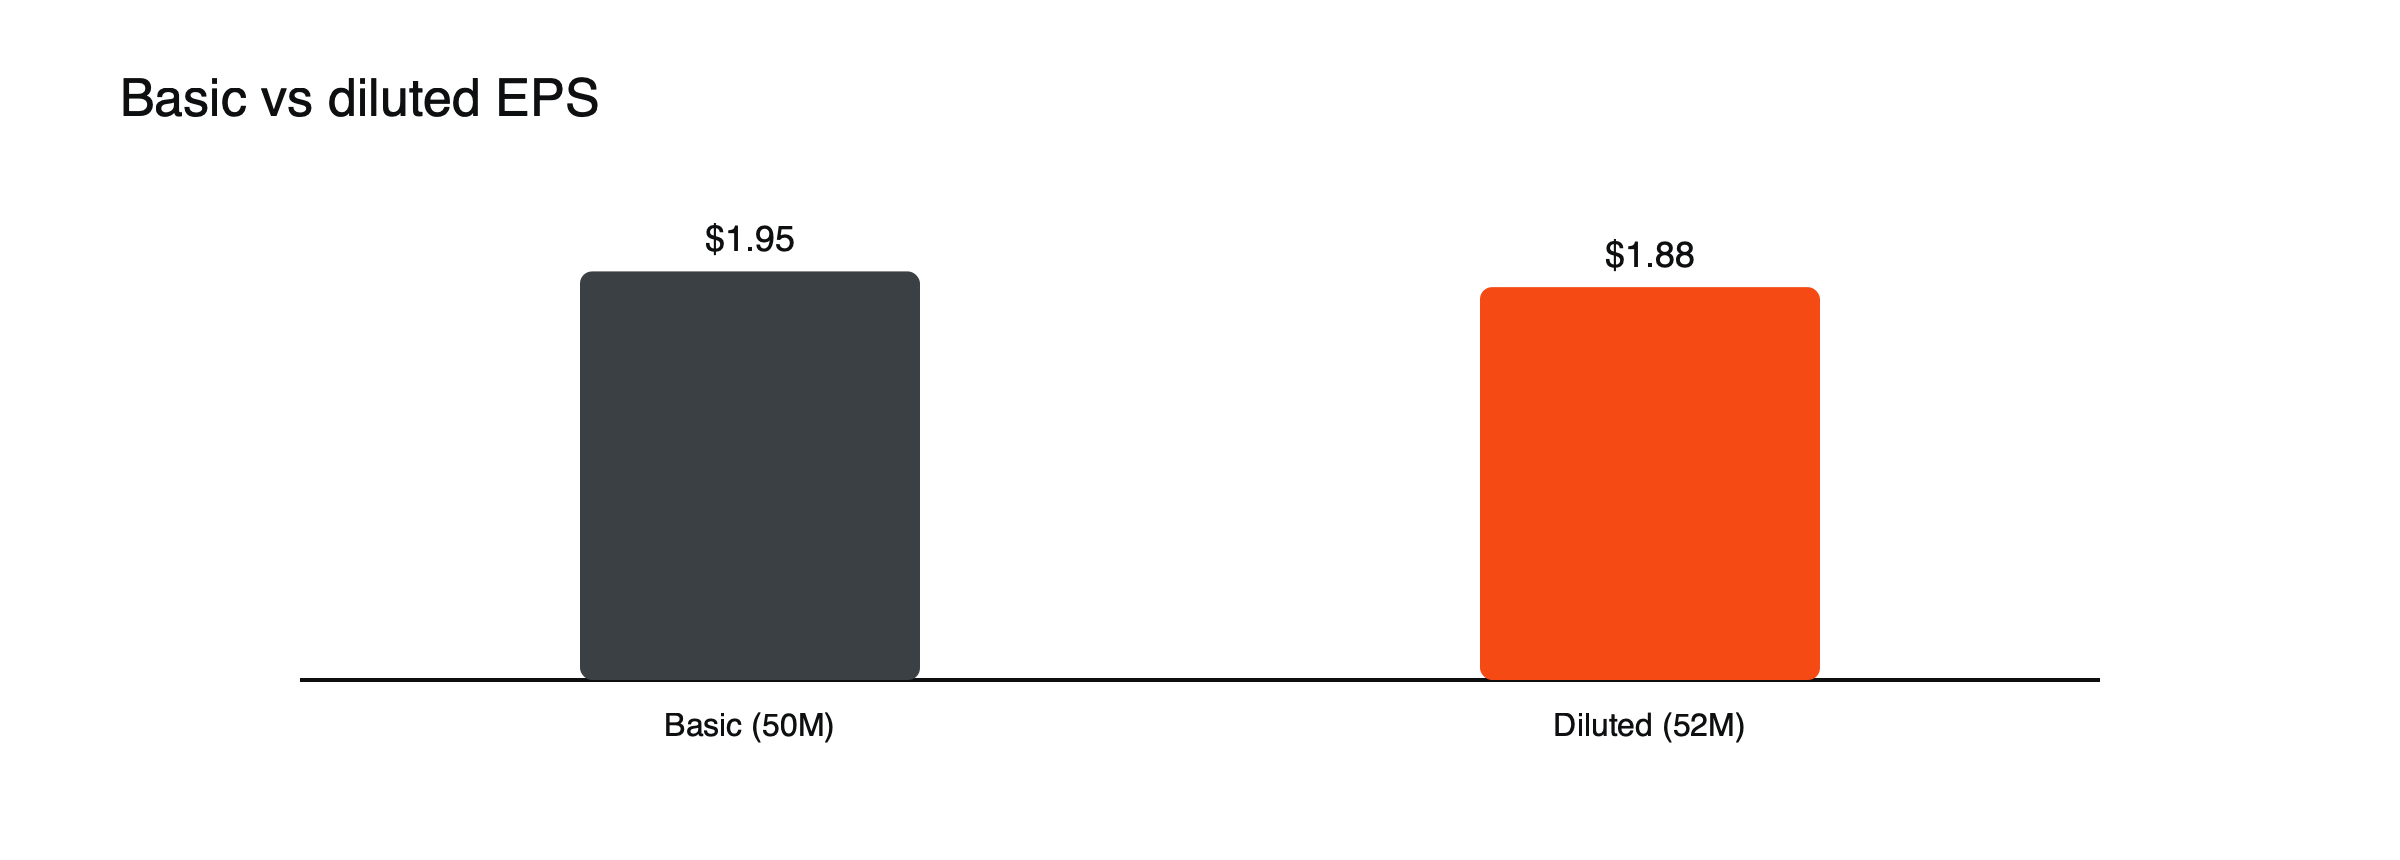
Figure: Dilution lowers EPS (hypothetical example).
How the weighted average works
Because shares can be issued or bought back during the year, EPS uses the weighted average number of shares outstanding. If a company had 50 million shares for the first half of a year and 48 million for the second half after a buyback, the weighted average is 49 million. Using the year-end count instead would overstate EPS.
Dilution, worked through
Suppose a company has 50 million shares and 3 million employee options with an exercise price of $30, while the share trades at $39. (Hypothetical figures.) Under the usual accounting method, the company is assumed to use the $90 million it would receive from option exercises to buy back shares at $39, about 2.31 million shares. Net new shares are about 0.69 million, so diluted shares are about 50.69 million. Options that are out of the money, with exercise prices above the share price, are excluded because they would not be exercised.
Adjusted EPS
Companies often report “adjusted” EPS, excluding items such as restructuring costs or one-off gains. It can show underlying performance but is not standardized; compare it with reported EPS.
Adjusted EPS, worked through
Suppose ExampleCo records a $20 million restructuring charge, about $15 million after tax. Reported net income is $97.5 million, or $1.95 a share. Adding back the after-tax charge gives adjusted net income of $112.5 million and adjusted EPS of $2.25. (Hypothetical figures.) If restructuring charges appear every year, though, they are part of the business, and the adjusted figure flatters it. Comparing adjusted and reported EPS over several years shows whether “one-off” items really are one-off.
What changes EPS
- Profit growth raises it.
- Buybacks reduce share count and raise EPS even if profit is flat. See why companies buy back their own shares.
- New shares issued dilute it.
Buybacks, worked through
If ExampleCo’s profit stays at $97.5 million but it buys back 1 million shares, leaving 49 million, EPS rises from $1.95 to about $1.99, up about 2%, with no change in the business. Buybacks can be a sensible use of cash, but EPS growth that comes mainly from a shrinking share count is less valuable than growth from rising profits. Checking net income growth alongside EPS growth separates the two.
How it is used
EPS drives the P/E ratio and is the figure most earnings reports are judged on against estimates. See how to calculate and read a P/E ratio, how earnings reports move share prices and what moves stock prices.
EPS and earnings surprises
Each quarter, analysts publish EPS estimates, and the market judges results largely against the consensus. A company reporting $0.52 against an expected $0.48 has beaten by about 8%. But the share’s reaction depends also on revenue, margins and guidance, so a beat on EPS alone does not guarantee a rise. See how to read an earnings report.
EPS growth over time
Long-term share price performance tends to follow EPS growth. A company that grows EPS by 10% a year doubles its earnings in a little over seven years, and if investors keep paying the same multiple, the share price doubles too. Steady, high-quality EPS growth is one of the clearest signs of a strong business.
Common misreadings
- Comparing EPS between companies as if it measured value; a $10 EPS share is not cheaper than a $2 one.
- Taking adjusted EPS at face value without checking what was excluded.
- Ignoring how much EPS growth came from buybacks.
Preferred dividends
If a company has preferred shares, dividends owed to their holders are subtracted from net income before calculating EPS for ordinary shareholders, because that money is not available to them. For most large companies preferred shares are small or absent, but for some banks and utilities the adjustment can be meaningful.
Watching the share count
Tracking the number of shares over several years shows whether a company is returning capital through buybacks or diluting shareholders by issuing new shares, often to pay employees or fund acquisitions. A share count rising 2% to 3% a year quietly cuts each holder’s share of profits, even if total earnings grow. See why companies buy back their own shares.
The quality of EPS
EPS is only as good as the earnings behind it. Profits backed by strong operating cash flow are more reliable than profits that depend on accounting estimates, asset sales or one-off gains. Comparing net income with operating cash flow over several years is a simple quality check. See how to read a cash flow statement.
Reading EPS in a results release
Results releases usually show reported and adjusted EPS, often both basic and diluted, for the quarter and the year to date, alongside last year’s figures and sometimes guidance for the coming year. The headline number reported in the news is usually adjusted diluted EPS compared with the analyst consensus. Checking which figure is being compared avoids confusion.
Trailing and forward EPS
Trailing EPS uses reported earnings for the past twelve months; forward EPS uses analysts’ estimates for the next twelve. Share prices respond mostly to changes in forward expectations, so upgrades and downgrades to forward EPS often move a share more than the reported figure itself. Comparing the two shows whether earnings are expected to grow or shrink.
EPS and the P/E ratio
EPS is the denominator of the P/E ratio, so any distortion in EPS carries straight into the valuation. An EPS boosted by a one-off gain makes the P/E look lower than it really is; one depressed by a write-down makes it look higher. See how to calculate and read a P/E ratio.
EPS and dividends
Dividends are paid out of earnings, so comparing dividends per share with EPS gives the payout ratio. ExampleCo pays $1.17 a share from EPS of $1.95, a payout ratio of 60%, leaving the rest for reinvestment and buybacks. (Hypothetical figures.) A payout far above 100% would not be sustainable for very long.
Frequently asked questions
Why is diluted EPS usually lower than basic EPS?
Because it counts shares that could be created from options, warrants and convertible securities, increasing the share count without increasing profit.
Can EPS be negative?
Yes, when a company makes a loss. A negative EPS means the P/E ratio cannot be used.
Company figures in this article are a hypothetical example (“ExampleCo”) for illustration.
This article is educational content and does not constitute financial, investment, legal or tax advice. Digital assets are volatile and you may lose the amount you invest.