
Why Do Most Cryptocurrencies Move Together?
Most coins rise and fall with bitcoin because they share liquidity, traders and leverage. See what drives crypto correlation and when it breaks down.

Most cryptocurrencies move together because they share the same pool of money, the same traders and the same leverage. Bitcoin sits at the center of that pool, so when it rises or falls, buying and selling spreads to almost every other coin. This crypto correlation is strongest in sharp sell-offs and weakest when news is specific to one project.
Correlation in plain numbers
Correlation measures how closely two price series move together, on a scale from 1 (they move in lockstep) through 0 (no relationship) to −1 (they move in opposite directions). Analysts calculate it on daily returns, not on prices, usually over a rolling window such as 30 or 90 days, so the figure changes as the window moves.
Two points are often confused:
- Correlation is about direction, not size. Two coins can have a correlation of 0.9 while one moves three times as much as the other.
- Beta captures size. A coin with a beta of 2 to bitcoin has tended to move about twice as much as bitcoin, in the same direction.
If bitcoin falls 5% and an altcoin with a beta of 1.8 and high correlation follows its usual pattern, the altcoin would fall about 9%. That is why smaller coins feel even more tied to bitcoin than the correlation figure alone suggests. (Illustrative figures.)
Why the market moves as one
The same doors in and out
Most crypto trading runs through the same large exchanges, the same market makers and the same dollar stablecoins. When investors want less risk, they sell coins for stablecoins or cash; when they want more, they usually buy bitcoin first and then move further out into smaller coins. Money enters and leaves through the same doors, so it pushes prices in the same direction.
Shared leverage
Many traders hold several positions on one margin account. A sharp fall in bitcoin can trigger margin calls that force them to sell other coins too, whatever their own prospects. On October 10, 2025, more than $19 billion of leveraged positions were wiped out across the market in a single sell-off. See how liquidation cascades work.
One investor base, one mood
Retail and institutional crypto investors read the same headlines and react to the same macro news, especially changes in interest-rate expectations. Enthusiasm and fear spread across the whole market at once. See why crypto and tech stocks often trade as the same risk asset.
What the data shows
Correlation is high among the largest coins, but it is neither fixed nor uniform:
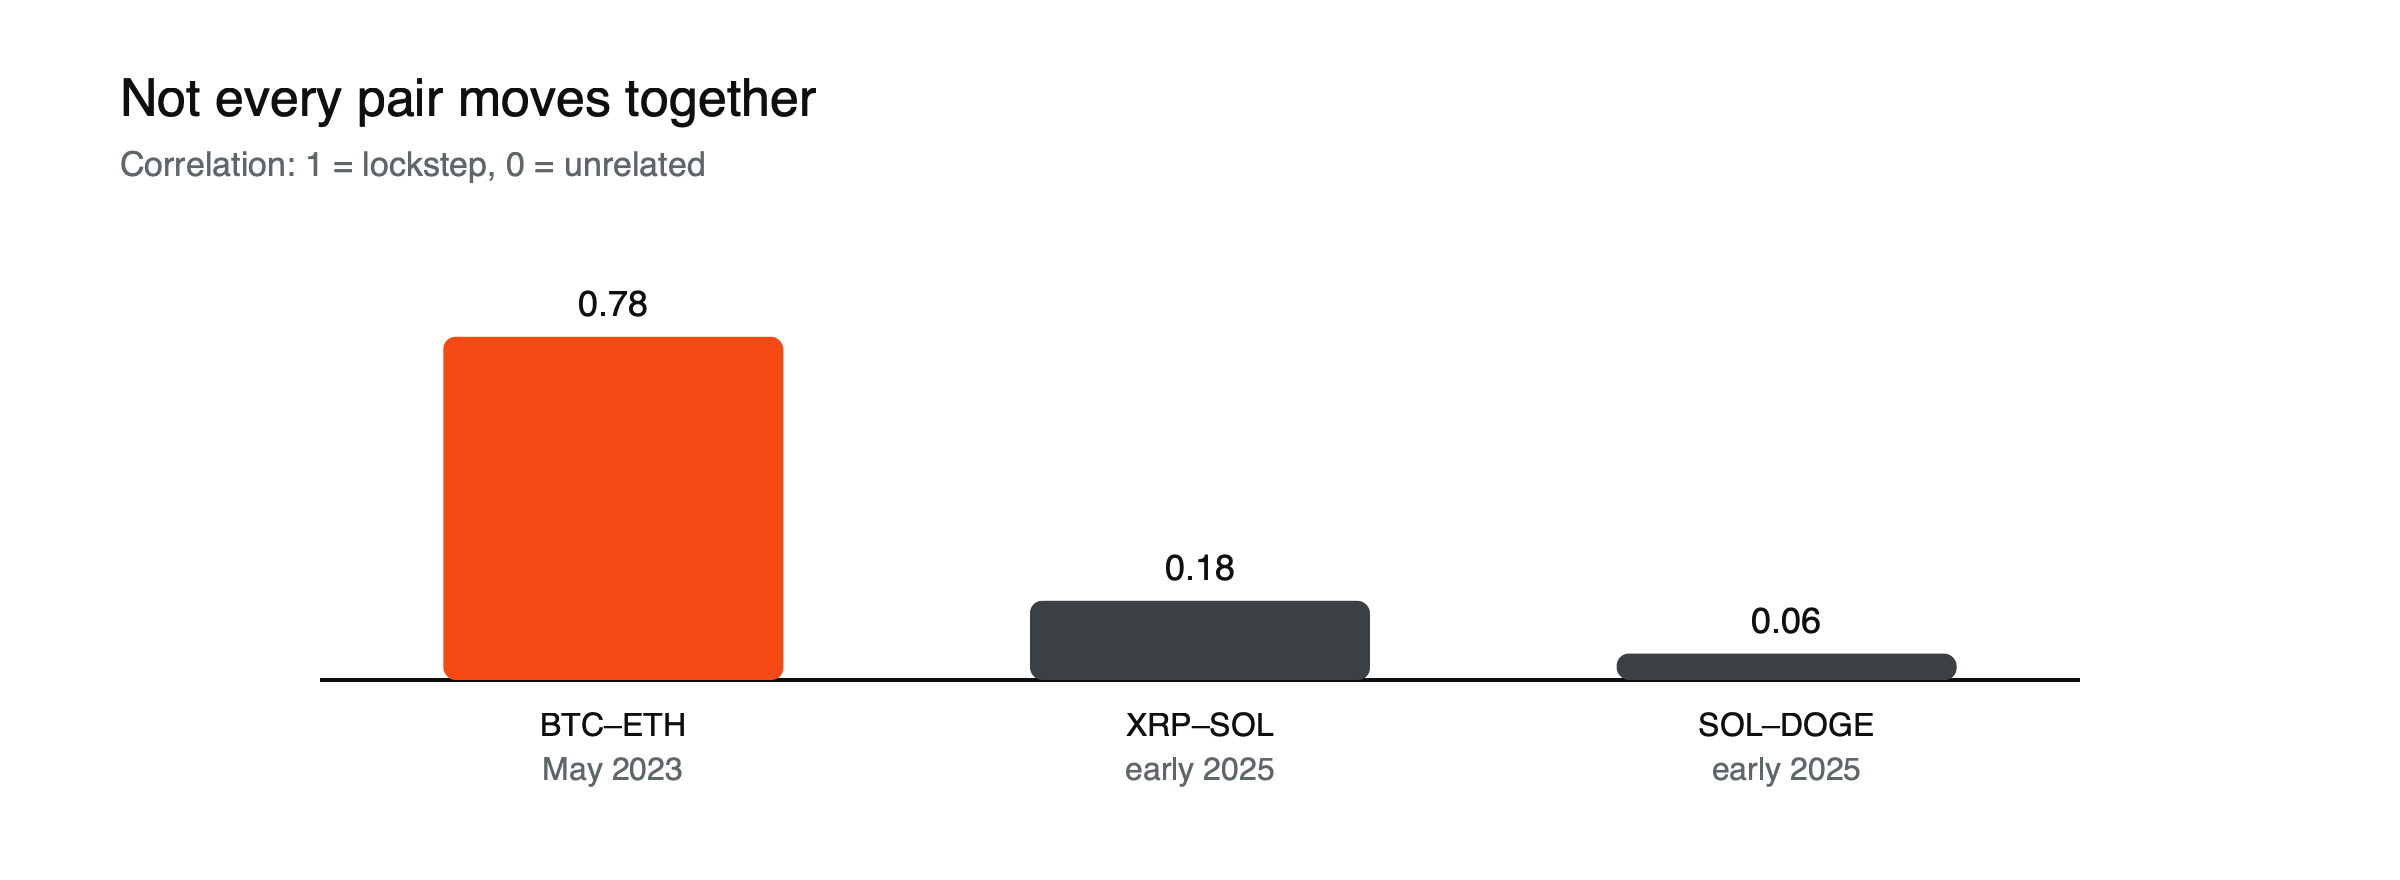
Figure: Correlation varies by pair and over time. Data: Kaiko (BTC–ETH 30-day correlation via FXStreet, May 2023; other pairs from Kaiko, February 2025).
| Pair | Measurement | Figure |
|---|---|---|
| Bitcoin and ether | 30-day correlation, May 2023 | 0.78, the first reading below 0.80 in 18 months |
| XRP and Solana | Early 2025 | 0.18 |
| Solana and Dogecoin | Early 2025 | 0.06 |
The May 2023 dip happened while bitcoin was rising during US banking stress and ether lagged, a reminder that even the two largest coins can separate when the story behind each one differs. Pairs further from the center of the market can be much looser on calm days.
So “everything moves together” is mostly true for the largest coins and mostly true in sell-offs. It is far less reliable for smaller coins when nothing dramatic is happening.
Why correlation rises in a crash
Correlations tend to jump exactly when diversification is needed most. In a sell-off, the forces that link coins, forced selling and the rush to stablecoins, dominate every project-specific factor. A portfolio that looked spread across ten coins on a quiet week can behave like a single position on the worst day of the month.
Diversifying inside crypto: what helps and what doesn’t
What doesn’t help much: holding more coins of the same kind. Ten altcoins with high correlation to bitcoin and higher beta add risk rather than spreading it.
What helps a little: mixing coins whose demand comes from different sources, such as a payment network and an application platform, can lower correlation on calm days. It rarely protects in a crash.
What actually changes the risk: the share of the portfolio held in stablecoins or outside crypto altogether. Position size, not the number of coins, decides how much a market-wide fall hurts. See why diversification failed in 2022.
How to check correlation yourself
You do not need special software to see how closely two coins have moved together:
- Download daily closing prices for both coins over the period you care about, from the same source and the same time zone, so each day lines up.
- Turn prices into daily returns: today’s close divided by yesterday’s close, minus one. Correlating raw prices exaggerates the link, because almost any two assets that trend upward will look related.
- Calculate the correlation of the two return series, for example with the CORREL function in a spreadsheet, over a 30-day and a 90-day window.
- Compare windows. If the 30-day figure is far below the 90-day figure, something specific to one of the coins has changed recently.
- Look at the worst days separately. Filter for days when bitcoin fell more than a few percent and check how the other coin behaved. That is the correlation that matters for risk.
A single number hides a lot. Two coins can show moderate correlation over a quarter and still fall together on every bad day within it.
When a coin breaks away
The correlation weakens when a coin has its own reason to move:
- A protocol upgrade or a major new use case.
- A hack, exploit or legal action against the project.
- A large token unlock that adds supply.
- A listing on, or removal from, a major exchange.
A coin that moves against the market on its own news is showing its own drivers. One that keeps tracking bitcoin through good and bad project news is showing how much its price depends on the wider market rather than on itself.
Correlation also helps explain the rhythm of crypto rallies. Money tends to arrive in bitcoin first and spread outward only once confidence builds, which is why altcoins often lag early in a rally and outperform late in it. See what altcoin season is and what a crypto market cycle is.
For the basics of the asset class itself, see what cryptocurrency is.
This article is educational content and does not constitute financial, investment, legal or tax advice. Digital assets are volatile and you may lose the amount you invest.
Sources
- Bitcoin and Ethereum rolling correlation declined below 80% first time in 18 months (Kaiko data, 30-day correlation 78%) — FXStreet, May 2023
- Moving Beyond Bitcoin with the KT5 Index (SOL–DOGE 0.06; XRP–SOL 0.18) — Kaiko, February 2025
- DeFi TVL drops 39% in 2026 (October 10, 2025 crash erased more than $19 billion in leveraged positions) — Cointelegraph, June 2026