
What Is RSI and How Do Traders Read It?
RSI compares recent gains with recent losses on a 0 to 100 scale. The formula, a worked example, what readings of 70 and 30 mean and where RSI misleads traders.
The Relative Strength Index (RSI) is a momentum indicator that compares recent gains with recent losses on a 0 to 100 scale. J. Welles Wilder introduced it in 1978 with a default 14-period lookback. Readings above 70 are called overbought and below 30 oversold, but in strong trends RSI can stay there for long periods.
The formula
RS = average gain ÷ average loss over the lookback period
RSI = 100 − 100 ÷ (1 + RS)
The first averages are simple averages of the gains and losses over 14 periods. After that, Wilder’s method smooths them: new average gain = (previous average gain × 13 + current gain) ÷ 14, and the same for losses.
Worked example
Over 14 days, the average daily gain is $300 and the average daily loss is $150.
- RS = 300 ÷ 150 = 2
- RSI = 100 − 100 ÷ 3 = 66.7
If instead the average gain is $100 and the average loss $300, RS = 0.33 and RSI = 25, in oversold territory.
The next day, with Wilder’s smoothing
Continue the first example. The average gain is $300 and the average loss $150, giving an RSI of 66.7. The next day the price rises by $600 with no loss.
- New average gain = ($300 × 13 + $600) ÷ 14 ≈ $321.43
- New average loss = ($150 × 13 + $0) ÷ 14 ≈ $139.29
- RS ≈ 2.31, so RSI ≈ 69.8
One strong day moves RSI only modestly, because the smoothing gives each new day a weight of one fourteenth. That is why RSI changes gradually rather than jumping with every candle.
How traders read it
Overbought and oversold. Above 70, gains have dominated recently; below 30, losses have. These are signs of stretched momentum, not instructions to buy or sell.
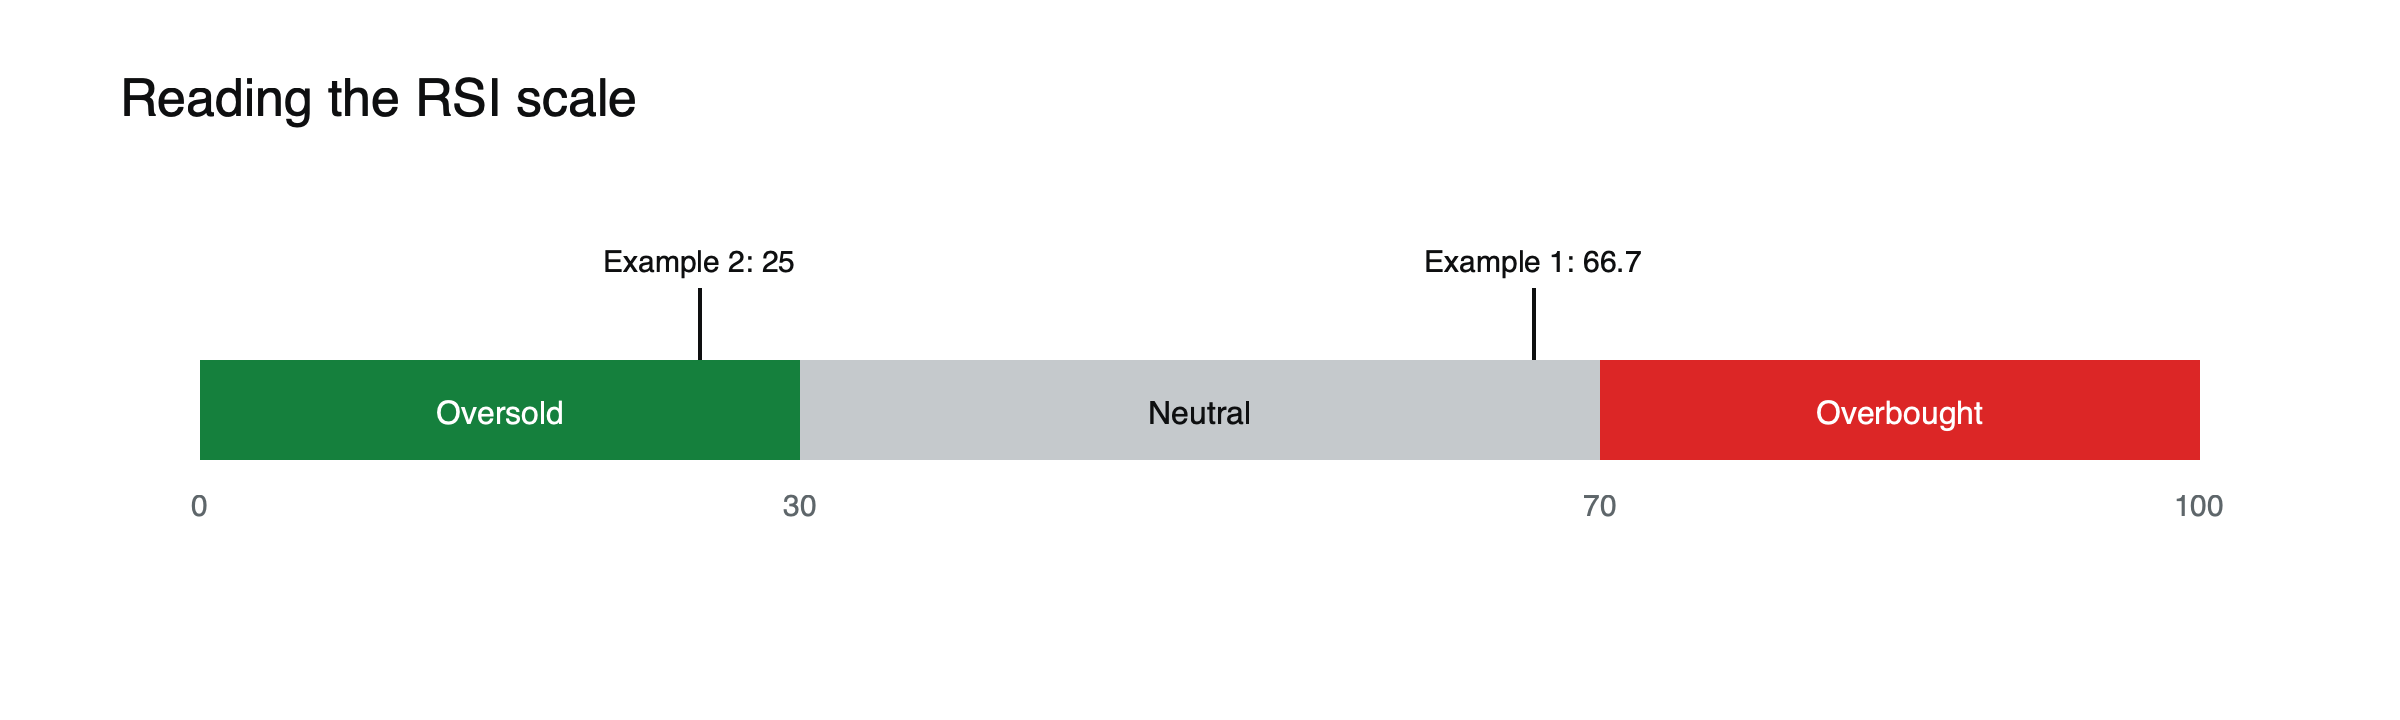
Figure: Where the worked examples fall on the RSI scale.
The 50 line. RSI above 50 means average gains exceed average losses; many traders use it as a simple trend filter.
Divergence. If price makes a new high but RSI makes a lower high, momentum is weakening. Divergences can last a long time before price turns, if it turns at all.
RSI in trends and ranges
Many technicians observe that RSI behaves differently depending on the market’s state. In a strong uptrend it tends to stay in an upper band, rarely falling much below 40 and frequently reaching 70 or higher. In a downtrend it tends to stay low, often failing to climb much above 60. In a sideways range, it swings more evenly between 30 and 70. Reading RSI against the trend it sits in avoids the most common mistake: selling every overbought reading in a rally or buying every oversold reading in a decline.
Adjusting the settings
The default 14-period setting is a convention, not a rule. Shorter periods make RSI more sensitive and produce more signals, many of them false; longer periods make it smoother and slower. Some traders widen the thresholds to 80 and 20 for volatile assets like crypto, so that only more extreme readings stand out. Whatever settings you use, keeping them consistent makes your observations comparable over time.
Divergence, worked through
Suppose bitcoin peaks at $60,000 with RSI at 75, pulls back, then rises to a higher peak of $62,000 while RSI reaches only 68. (Illustrative figures.) Price made a higher high, but momentum made a lower high: a bearish divergence. It suggests buying pressure is fading, but not when, or whether, the price will turn. Divergences can repeat several times during a long rally before any meaningful decline, so many traders wait for price itself to break a recent low before acting on one.
Variants of RSI
Traders have built several indicators on top of RSI. Stochastic RSI applies a further calculation to RSI values to make them swing more quickly between extremes, which produces more signals and more noise. Some platforms also offer RSI with moving averages drawn over it, to smooth readings further. Each variant changes the balance between speed and reliability rather than adding new information about price.
RSI at a level that matters
RSI readings carry more weight when they coincide with a meaningful price level. Suppose bitcoin falls into a support zone that has held several times before, while daily RSI drops below 30 and then turns back up. (Illustrative scenario.) A trader might treat that combination as a reason to consider buying, with a stop just below the support zone. The RSI reading alone would not justify the trade, and neither would the level alone; together, with a clear point at which the idea is proved wrong, they form a plan rather than a guess. If the support breaks, the stop closes the trade regardless of what RSI says. Writing the plan down before the trade, including what would cancel it, keeps the decision from being rewritten in the heat of the moment, when emotions are strongest and judgment is weakest.
Where RSI misleads
- Strong trends: in a powerful rally, RSI can stay above 70 for weeks while price keeps rising.
- Different settings: some platforms smooth with a standard exponential average instead of Wilder’s method, so the same chart can show different RSI values.
- Timeframe: a 70 reading on a 15-minute chart means something very different from one on a weekly chart.
- Crypto volatility: fast moves push RSI to extremes more often than in slower markets.
Use RSI alongside price structure, such as support and resistance, and volume. See how to read trading volume. For a related tool, read SMA vs EMA, and for the basics, what spot trading is.
This article is educational content and does not constitute financial, investment, legal or tax advice. Digital assets are volatile and you may lose the amount you invest.
A failed signal, illustrated
Suppose bitcoin rallies and RSI on the daily chart reaches 75. (Illustrative scenario.) A trader reads that as overbought and opens a short. Over the next two weeks, the price keeps rising while RSI hovers between 70 and 85, and the short is stopped out at a loss. Nothing was wrong with the calculation; the reading simply described strong momentum, which can persist far longer than a single indicator suggests. Waiting for a confirming change in price structure, such as a break below a recent low, would have avoided the trade.
Frequently asked questions
What is the best RSI setting for crypto?
There is no single best setting. The 14-period default is the most widely used, which itself gives it some relevance, since many traders watch the same levels. Testing a setting on past data before relying on it is more useful than copying someone else’s choice.
Is RSI useful on its own?
Rarely. It describes momentum, not direction or value. Most traders combine it with price structure, trend and volume rather than acting on RSI alone.