
Stock Valuation Mistakes Beginners Make
Six look-alike companies show common stock valuation mistakes: cyclical peaks, hidden debt, adjusted profits, yield traps, profits without cash and rates.
Common stock valuation mistakes include assuming a low P/E means a stock is cheap, ignoring debt, trusting adjusted earnings without checking them, being drawn in by a very high dividend yield, overlooking cash flow and forgetting that interest rates change what any valuation is worth. A set of look-alike companies shows how each one hides.
How the test works
Imagine running a simple stock screen for cheap shares and getting six results. Each looks attractive on the number the screen used: a low P/E, a high dividend yield or strong reported profits. Each hides a different problem that only appears when you look past the headline figure. The companies are hypothetical, but the patterns are common in real markets. The aim is to show which second number to check before trusting the first.
Company A: the cyclical at its peak
What the screen shows: a carmaker trading at $100 with earnings of $10 a share, a P/E of 10, well below the market average.
What is underneath: car sales are at a record, helped by cheap credit and pent-up demand. Over a full cycle, the company has averaged earnings of about $5 a share. On those normal earnings, the P/E is 20. When the cycle turns, earnings could halve, and the share would no longer look cheap.
The mistake: treating a low P/E as cheap without asking whether earnings are at a cyclical high. The check: compare current earnings with their average over several years. See cyclical vs defensive stocks.
Company B: the hidden debt
What the screen shows: a P/E of 10, the same as a debt-free peer: both have a market value of $1,000 million and net income of about $100 million.
What is underneath: Company B carries $1,500 million of net debt. Its enterprise value is $2,500 million against EBITDA of $300 million, an EV/EBITDA of about 8.3, compared with about 6.3 for the debt-free peer, whose EV is $1,000 million against EBITDA of $160 million. Net debt is five times EBITDA, which leaves little room if profits fall or interest rates rise.
The mistake: ignoring debt because the P/E does. The check: look at enterprise value measures and net debt to EBITDA. See what EV/EBITDA is.
Company C: the adjusted profits
What the screen shows: adjusted earnings of $100 million on a market value of $1,000 million, a P/E of 10.
What is underneath: the company has excluded restructuring charges every year for five years. This year’s charge of $80 million, about $60 million after tax, means reported net income is $40 million, a P/E of 25. Costs that recur every year are part of running the business.
The mistake: trusting adjusted earnings without checking what was removed. The check: compare adjusted with reported earnings over several years. See how earnings per share is calculated.
Company D: the yield trap
What the screen shows: a dividend of $1.80 on a $20 share, a yield of 9%, three times the market average.
What is underneath: earnings per share are $1.30, so the payout ratio is about 138%, and free cash flow is only $1.10 a share. The dividend is being paid partly from borrowing. The high yield exists because the share price has fallen as investors anticipate a cut.
The mistake: chasing a yield without checking whether it is covered. The check: compare the dividend with earnings and free cash flow. See how to calculate dividend yield.
Company E: profits without cash
What the screen shows: net income of $100 million, up 25% on last year, on a P/E of 10.
What is underneath: operating cash flow is only $40 million, because receivables rose by $70 million: customers are taking longer to pay, or sales were booked on generous terms. Profits that do not turn into cash may be overstated, or may never be collected.
The mistake: ignoring cash flow. The check: compare net income with operating cash flow over several years. See how to read a cash flow statement.
Company F: the same P/E in a different rate world
What the screen shows: a quality company on a P/E of 25, the same multiple it traded at two years ago, so it looks no more expensive than before.
What is underneath: a P/E of 25 means an earnings yield of 4%. Two years ago, 10-year government bonds yielded 1.5%, so the shares offered 2.5 percentage points more. Now bonds yield 4.5%, so the shares offer 0.5 points less than a safe bond. The same multiple is far less attractive.
The mistake: forgetting that interest rates change what any valuation is worth. The check: compare the earnings yield with bond yields. See how interest rates affect stock prices. (All companies in this test are hypothetical.)
The six look-alikes in one table
| Company | Looked cheap because | Second number to check | What it revealed |
|---|---|---|---|
| A | P/E 10 | Average earnings over a cycle | P/E 20 on normal earnings |
| B | P/E 10 | EV/EBITDA, net debt to EBITDA | 8.3× EV/EBITDA; debt 5× EBITDA |
| C | Adjusted P/E 10 | Reported earnings | Reported P/E 25 |
| D | 9% yield | Payout ratio, free cash flow | 138% payout; dividend not covered |
| E | Fast profit growth | Operating cash flow | Only $40m cash on $100m profit |
| F | Same P/E as before | Earnings yield vs bonds | Premium over bonds turned negative |
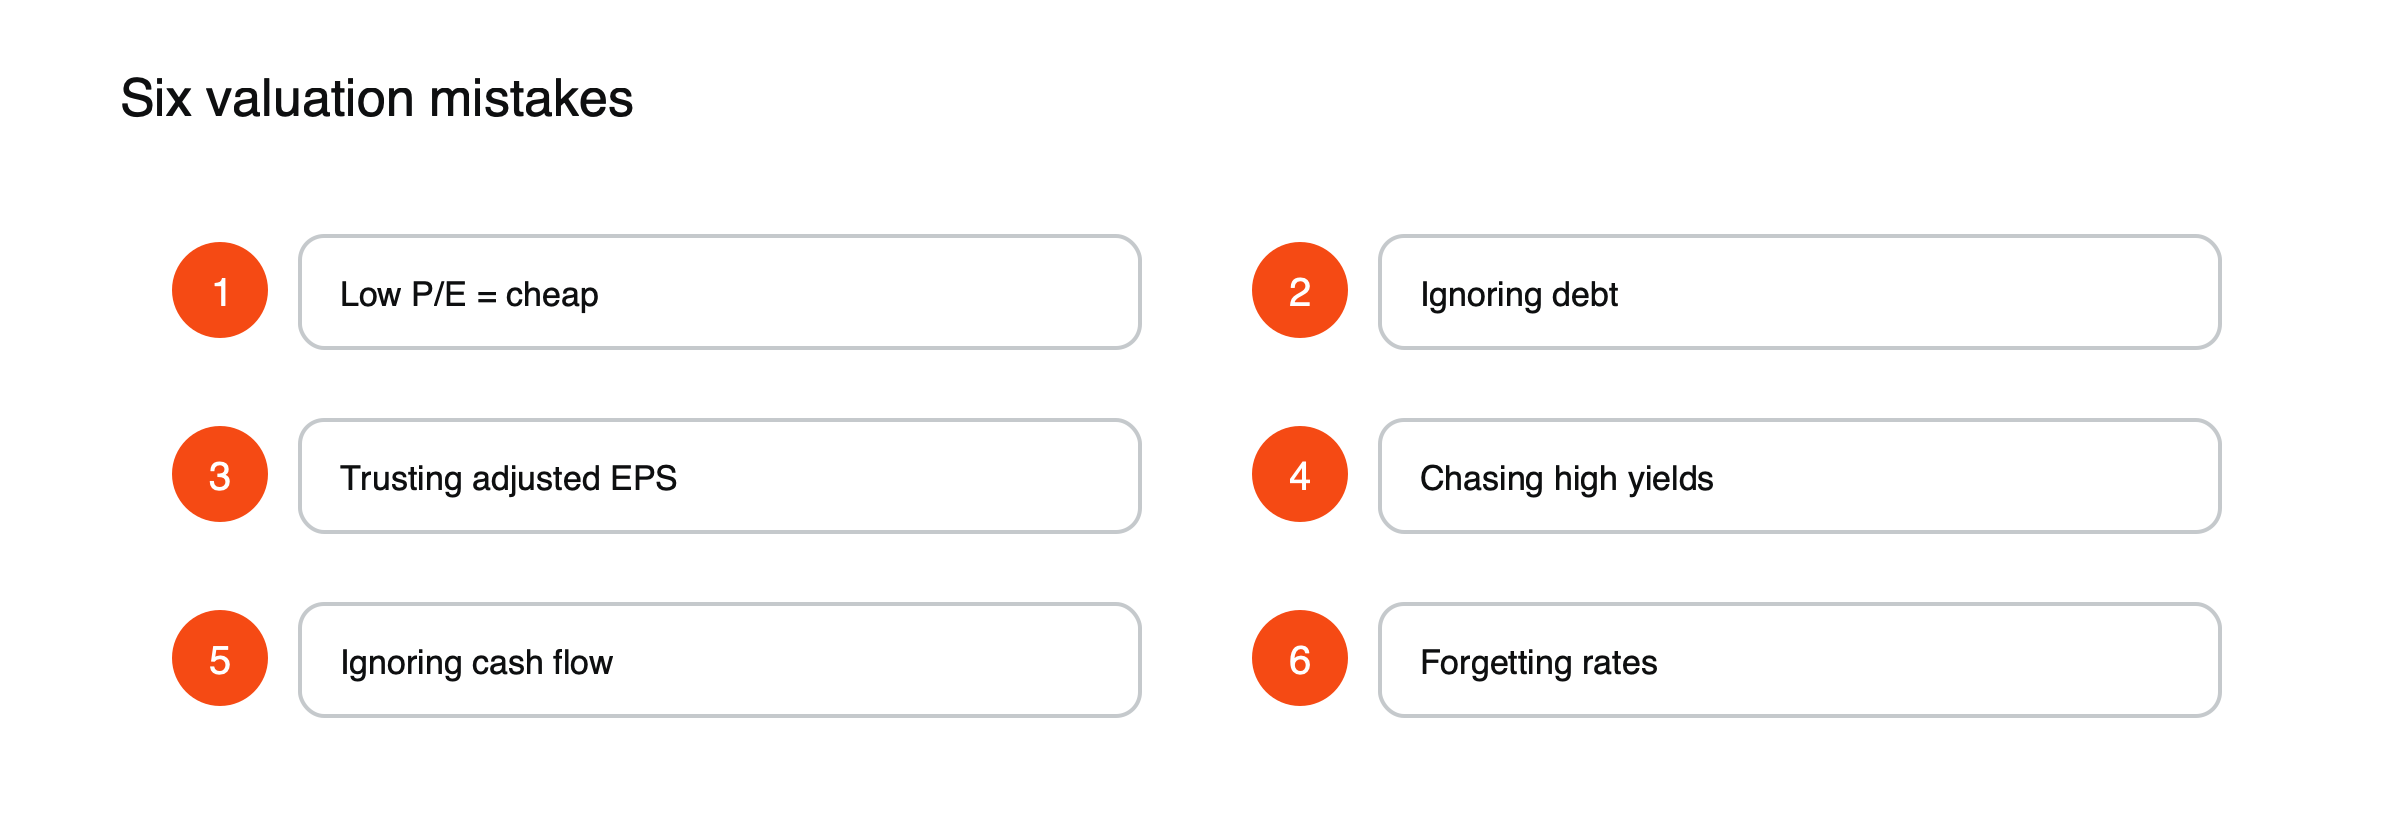
Figure: Six valuation mistakes.
Why the pairing matters
Every valuation measure leaves something out. P/E ignores debt and the cycle; adjusted earnings leave out charges; dividend yield ignores coverage; profit ignores cash; every multiple ignores the level of interest rates. The habit that prevents most mistakes is simple: never rely on one number, and always pair it with the check that covers its blind spot. See what moves stock prices and how stock CFDs work.
Running the second check yourself
For any share that looks cheap, write down the number that made it look cheap, then find the paired check from the table. For a low P/E, look up earnings over the past five to ten years and net debt. For a high yield, find the payout ratio and free cash flow per share. For strong profits, find operating cash flow. For any multiple, note today’s 10-year bond yield. These checks take minutes using a company’s published statements and remove most of the traps shown above. See how to research a stock before trading it.
When cheap really is cheap
Not every low multiple is a trap. Sometimes shares are cheap because investors are overly pessimistic about a temporary problem, or because a company is little known or out of favor. The difference is that the second checks come back clean: earnings are not at a peak, debt is manageable, reported and adjusted profits are close, the dividend is covered and cash flow matches profits. Shares that pass those tests and still look cheap are the ones worth a closer look.
A screen is only the start
Stock screens are useful for narrowing thousands of shares down to a short list, but every filter rests on a single number with its own blind spot. Treating the screen’s output as a list of bargains, rather than a list of questions, is how most of the mistakes in this article begin. Good analysis always starts exactly where the screen stops.
This article is educational content and does not constitute financial, investment, legal or tax advice. Digital assets are volatile and you may lose the amount you invest.