
Sector ETFs vs Broad Market ETFs
Broad market ETFs spread money across a whole index; sector ETFs focus on one industry. How they differ in risk, cost and use, and when each one fits.
Sector ETFs vs broad market ETFs differ in concentration. A broad market ETF, such as one tracking the S&P 500, holds hundreds of companies across industries; a sector ETF holds one industry, such as technology or energy. Sector ETFs let you target a view but swing more and depend on one part of the economy.
Side by side
| Broad market ETF | Sector ETF | |
|---|---|---|
| Holdings | Hundreds of companies, all sectors | One industry |
| Volatility | Lower | Usually higher |
| Typical fees | Very low (0.03% for some S&P 500 ETFs) | Higher on average |
| Use | Core holding | Targeted views, rotation |
| Main risk | Market risk | Sector-specific shocks |
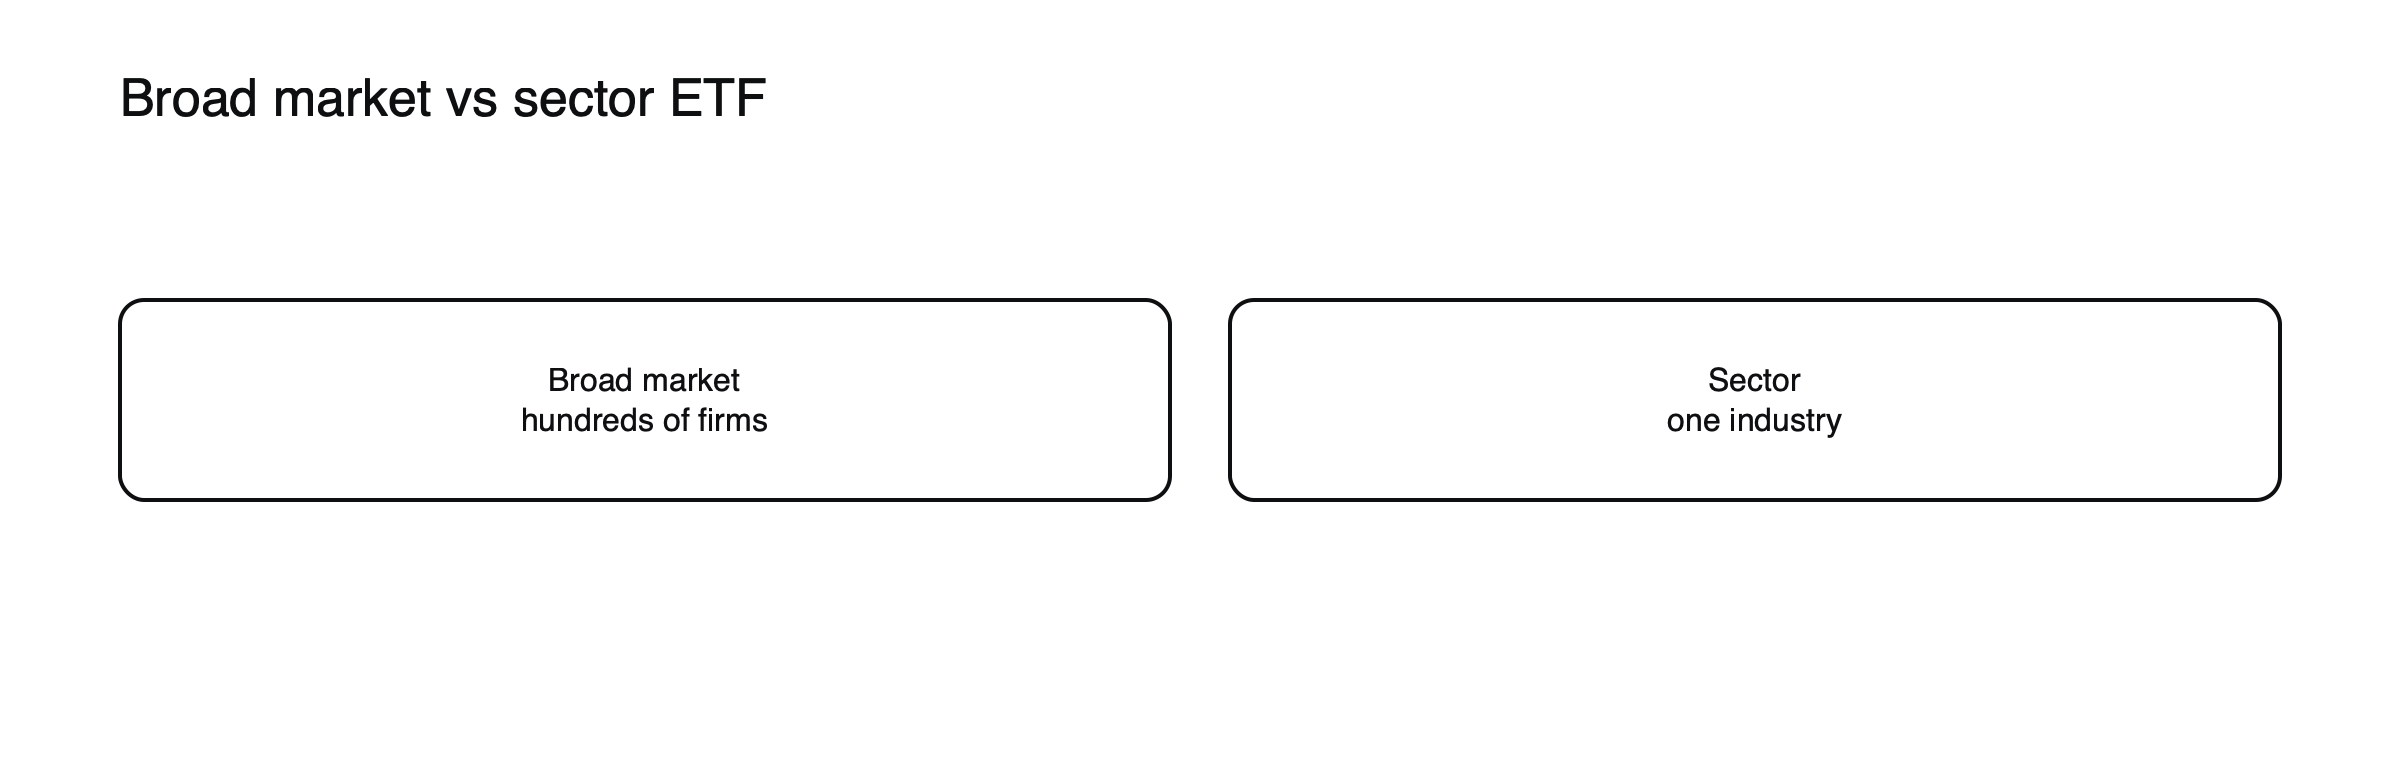
Figure: Breadth vs focus.
Volatility compared, illustrated
Suppose the broad market falls 10% in a downturn. (Illustrative scenario.) A defensive sector such as utilities might fall 5%, while a cyclical sector such as energy or technology falls 15% to 20%. On the way up, the pattern can reverse. A sector ETF therefore magnifies or dampens the market’s moves depending on the sector, and sizing should reflect that. See cyclical vs defensive stocks.
When sector ETFs fit
Expressing a view on a sector’s outlook, sector rotation through the economic cycle, or adding exposure the broad market lacks. See what sector rotation is.
The overlap problem
Broad indices can already be heavy in one sector; information technology is close to 40% of the S&P 500, so adding a tech ETF doubles down. See why a handful of stocks can drive an entire index.
Overlap, worked through
An investor holds 80% of a portfolio in an S&P 500 ETF and adds 20% in a technology sector ETF to increase technology exposure. With technology close to 40% of the S&P 500, the portfolio’s technology weight becomes about 52%: 80% × 40%, or 32%, plus the 20% in the sector fund. (Example values.) A move intended as a modest tilt has made technology more than half the portfolio. Checking sector weights inside broad funds before adding sector ETFs avoids such unintended concentration.
Sector rotation, illustrated
Sector leadership tends to shift through the economic cycle. Early in recoveries, financials, industrials and consumer discretionary often lead; late in expansions, energy and materials; in slowdowns, utilities, healthcare and consumer staples tend to hold up better. Investors who rotate between sector ETFs try to anticipate these shifts, but the timing is difficult, and costs and taxes from frequent switching add up. See what sector rotation is.
When broad is less diversified than it looks
“Broad means diversified” is weaker today because large indices are concentrated in a few stocks; equal-weight or multi-sector ETFs can be more balanced.
See what an ETF is and cyclical vs defensive stocks.
Fees
Broad market ETFs on major indices are among the cheapest funds available, at 0.03% a year for some S&P 500 funds. Sector ETFs usually charge more, and thematic funds, which target narrower ideas such as robotics or clean energy, often charge 0.6% or more. Over long periods, fee differences compound into meaningful gaps.
How sectors are defined
Most sector ETFs follow standard classification systems that group companies into sectors and industries. Classifications change occasionally, moving large companies between sectors, which can alter what a sector ETF holds. A company’s sector label does not always match how investors think of it, so checking a sector ETF’s largest holdings is worthwhile.
Equal-weight and multi-sector alternatives
Investors worried about concentration in broad cap-weighted indices can use equal-weight versions, which give each company the same weight, or funds that cap sector weights. These spread risk more evenly but may cost more and behave differently from the main index.
Sector ETFs in a sell-off
In broad market sell-offs, sector differences can be stark. Defensive sectors may hold up while those tied to growth or commodities fall much further. In a crash driven by a specific industry, such as banks in a financial crisis or technology after a bubble, that sector’s ETF can lose far more than the market. A sector ETF is a concentrated bet, and its worst days can be much worse than the broad market’s.
Concentration inside sector ETFs
Sector ETFs can be dominated by a handful of companies. A technology sector fund weighted by market value may hold a few giants at very large weights, making it behave much like those companies. Some sector funds cap individual weights to limit this, which changes their behavior relative to an uncapped version. Checking the top ten holdings shows how concentrated a sector fund really is.
Using sector ETFs to hedge
An investor holding several shares in one industry can reduce sector risk by shorting the matching sector ETF, through a CFD or by borrowing shares. That leaves exposure to how their chosen companies perform relative to the sector, while reducing exposure to news that moves the whole industry. See ETF CFDs vs buying ETF shares.
Common misreadings
- Treating a sector ETF as diversified because it holds many companies.
- Adding sector funds without checking overlap with broad holdings.
Core and satellites, illustrated
Some investors use a core-and-satellite approach: most of the portfolio, say 85%, in a broad market ETF, and smaller satellite positions, say 5% each in three sector ETFs reflecting specific views. (Illustrative mix, not a recommendation.) If a satellite view is wrong, the damage is limited to a small part of the portfolio; if it is right, it adds to returns. Before adding satellites, checking how much of each sector the core already holds avoids accidental doubling up.
Sectors and interest rates
Sectors respond differently to interest rates. Technology and other growth sectors tend to suffer when rates rise, because more of their value lies in distant profits. Banks often benefit from higher rates through wider lending margins. Utilities and real estate, which carry heavy debt and pay steady dividends, tend to fall when bond yields rise. Rate expectations are therefore one of the main drivers of sector ETF performance.
Trading sectors with CFDs
CFDs on liquid sector ETFs let traders take short-term long or short positions on a sector with leverage, typically capped at 5:1 for EU retail clients. Because sector funds swing more than the broad market, positions are usually sized smaller for the same risk.
Thematic funds versus sector funds
Thematic ETFs target ideas that cut across sectors, such as cybersecurity or clean energy, often holding smaller, more speculative companies. They tend to charge more than sector funds, and research suggests only a minority beat broad markets over long periods. Sector funds follow established classifications and are usually cheaper and more liquid.
A sector ETF checklist
- How much of this sector does my broad fund already hold?
- How concentrated are the top holdings?
- What does the fund cost compared with a broad ETF?
- How volatile has the sector been?
- Does the sector suit the current interest rate outlook?
- Is there a clear reason for the tilt, with a plan to review it?
These answers keep sector tilts deliberate rather than accidental.
Frequently asked questions
Should a sector ETF replace a broad ETF?
Usually not. Sector ETFs are mostly used alongside a broad core holding to express specific views.
Are sector ETFs good for short-term trading?
Liquid sector ETFs, and CFDs on them, are used for short-term views on sectors, but their larger swings call for smaller position sizes.
This article is educational content and does not constitute financial, investment, legal or tax advice. Digital assets are volatile and you may lose the amount you invest.
Sources
- VOO surpasses SPY as world’s biggest ETF (VOO 0.03% vs SPY 0.0945%) — ETF Database, February 2025
- What past sector concentrations tell us about today’s tech-heavy S&P 500 (IT near 40%) — CME Group, 2026
- Thematic funds: worth their outsized fees? (asset-weighted thematic fees over 0.6% vs about 0.35%; long-run success rates 15%–18%) — WealthManagement.com, 2024