
What Is Sector Rotation?
Sector rotation is money moving between stock sectors as growth, inflation and rate expectations change. How it works, typical patterns by cycle and its limits.
Sector rotation is the movement of money between groups of stocks as expectations for growth, inflation and rates change. Money tends to favor cyclical sectors when the economy is expected to strengthen and defensive ones when a slowdown looms. In 2022, as rates rose, defensive sectors outperformed while growth lagged.
Typical patterns (tendencies, not rules)
- Early recovery: cyclicals such as consumer discretionary, industrials and financials often lead.
- Mid-cycle: technology and industrials may continue to do well.
- Late cycle, rising inflation: energy and materials can lead.
- Slowdown or recession: consumer staples, utilities and healthcare tend to hold up better.
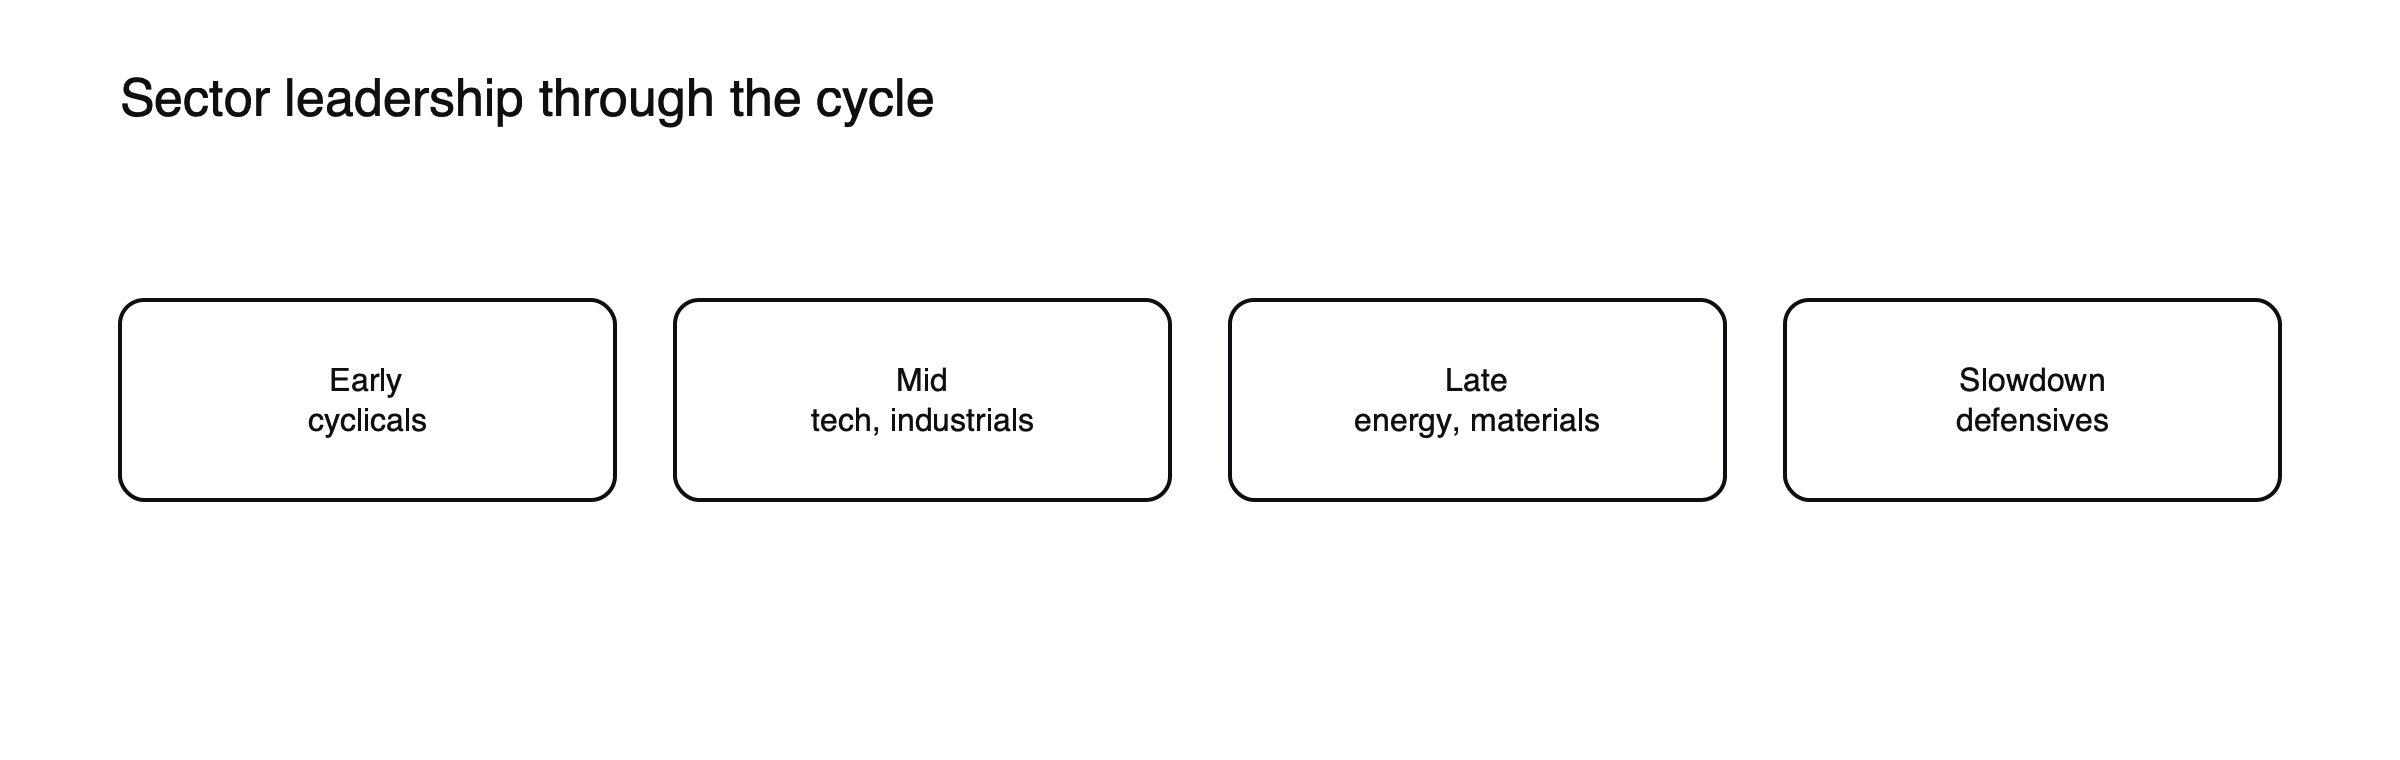
Figure: Tendencies, not rules.
The main sectors
Most market data use a standard classification with eleven sectors: communication services, consumer discretionary, consumer staples, energy, financials, healthcare, industrials, information technology, materials, real estate and utilities. Each has its own sector indices and funds, which makes it possible to compare their performance directly and track where money is flowing.
Why it happens
Each sector’s profits respond differently to the economy and to rates. As expectations shift, investors reposition, and those flows show up as sector leadership changes. See cyclical vs defensive stocks.
How rates and inflation shape leadership
| Environment | Sectors that have often led |
|---|---|
| Falling rates, slowing growth | Utilities, real estate, technology |
| Rising rates, strong growth | Financials, industrials, energy |
| High inflation | Energy, materials |
| Recession fears | Consumer staples, healthcare, utilities |
(Tendencies, not rules.)
2022 as an example
As inflation surged and central banks raised rates in 2022, energy shares rose strongly on high oil and gas prices, and defensive sectors such as utilities, healthcare and consumer staples outperformed the broad US market. Technology and consumer discretionary shares, sensitive to rates and to consumer spending, lagged badly. The pattern matched the textbook for a period of high inflation and rising recession fears.
How traders spot it
Compare sector performance with the broad index, watch relative strength over weeks, and follow bond yields and economic data that drive the shifts.
Relative strength, illustrated
Suppose over four weeks the S&P 500 rises 1%, the energy sector 5% and the technology sector falls 2%. Dividing each sector’s price by the index’s gives a relative strength line: energy’s line rises, technology’s falls. If the energy line has been rising for several months while the economy shows signs of inflation, rotation into energy may be under way. A single month proves little; a persistent trend across several sectors is a stronger signal. (Illustrative figures.)
Short-term versus cyclical rotation
Not all rotation reflects the economic cycle. On individual days, money can move between sectors because of a single data release, a large company’s results or changes in bond yields, and reverse the next day. Cyclical rotation plays out over months. Distinguishing the two avoids reading too much into a day’s moves.
Limits. Real cycles rarely follow textbook order; shocks, policy and technology trends can override the pattern. Rotation is often clear only in hindsight.
See how asset classes behave across the rate cycle, how interest rates affect stock prices and what moves stock prices.
Trading rotation
Traders who want to act on sector views can use sector funds, CFDs on sector indices where offered or baskets of representative shares. Others simply tilt a portfolio toward favored sectors. Because rotation is uncertain, many prefer gradual shifts rather than all-in bets, and they watch the same indicators that drive rotation, such as yields, inflation data and economic surveys, to judge whether a shift is continuing.
Sector weights in the index
Sectors are not equal in size. In the S&P 500, information technology has become by far the largest sector by weight, while utilities, materials and real estate each make up only a few percent. A strong month for technology moves the whole index; a strong month for utilities barely does. Comparing sector returns with the index’s return, rather than looking at absolute moves, shows where leadership really lies.
Sector funds and flows
Exchange-traded funds that track individual sectors make rotation easy for investors, and data on their inflows and outflows give a view of where money is moving. Large flows into a sector can push its shares up for a time, but flows often follow performance rather than lead it, so they confirm rotation more than predict it.
Rotation and earnings revisions
Sector leadership tends to follow changes in analysts’ earnings forecasts. When forecasts for a sector start rising faster than for the market, its shares often begin to outperform, and vice versa. Tracking revisions by sector gives an earlier signal than price performance alone. See what analyst upgrades and downgrades mean.
Rotation across countries
Because stock markets in different countries have different sector mixes, rotation can also show up as one market outperforming another. European and UK indices have relatively more banks, energy and consumer staples companies, while US indices are heavier in technology. A rotation from technology into energy and financials can therefore help European markets relative to the US.
A rotation checklist
- Which sectors are outperforming the index over one, three and six months?
- Are earnings revisions rising or falling by sector?
- What are bond yields and inflation doing?
- Do economic surveys point to acceleration or slowdown?
Common misreadings
- Treating one strong day as a rotation.
- Expecting every cycle to follow the textbook order.
A cycle of rotation, illustrated
Imagine a full cycle. (Illustrative sequence.) As a recession ends and rates are cut, consumer discretionary and financial shares lead, rising 25% in a year while the market gains 15%. As growth broadens, industrials and technology take over. Later, inflation picks up and energy and materials outperform while central banks raise rates. Finally, as growth slows, utilities, healthcare and consumer staples hold up best while the market falls. In practice, the stages overlap, last different lengths of time and are sometimes skipped altogether, but the broad sequence gives a framework for interpreting sector moves.
Concentration risk
Betting heavily on one sector concentrates risk in a way that diversification across sectors avoids. Sector moves can reverse quickly when the economic picture changes, and shares within a sector tend to move together, so a portfolio of five shares in one sector behaves much like one large position. Checking sector exposure before adding to a winning sector helps keep that risk in proportion. See how to calculate your exposure on a stock CFD.
Rotation and rate expectations
Changes in expected interest rates often drive the fastest rotations. When markets start to expect rate cuts, rate-sensitive sectors such as real estate, utilities and technology tend to rise; when they expect hikes, financials may gain while those sectors lag. Watching two-year bond yields, which reflect rate expectations, helps explain many sudden shifts in sector leadership. Rate expectations can change within hours of a data release, which is why sector leadership sometimes flips abruptly after major economic reports or central bank meetings.
Frequently asked questions
Can sector rotation be predicted?
Only roughly. The typical sequence is a useful guide, but real cycles vary, and shocks can change sector leadership suddenly. Many investors use rotation signals to adjust exposure gradually rather than to make large bets.
Which sectors are the most defensive?
Consumer staples, utilities and healthcare are usually considered the most defensive, because demand for their products changes little with the economy.
This article is educational content and does not constitute financial, investment, legal or tax advice. Digital assets are volatile and you may lose the amount you invest.