
How to Calculate Your Exposure on a Stock CFD
Exposure = shares × price in your account currency. 50 CFD shares at $200 is $10,000 of exposure on $2,000 of margin, so a 1% move is 5% of margin.
Stock CFD exposure is the full value of the shares a position tracks: exposure = CFD shares × share price, in your account currency. Exposure, not margin, sets your profit or loss. On 50 shares at $200, exposure is $10,000; at 5:1, margin is $2,000, so a 1% move is $100, or 5% of margin.
The formula
Exposure = shares × price
Margin = exposure × margin rate (20% at 5:1)
P&L for a move = exposure × % move
Worked example
- 50 CFD shares at $200
- Exposure: $10,000
- Margin at 5:1: $2,000
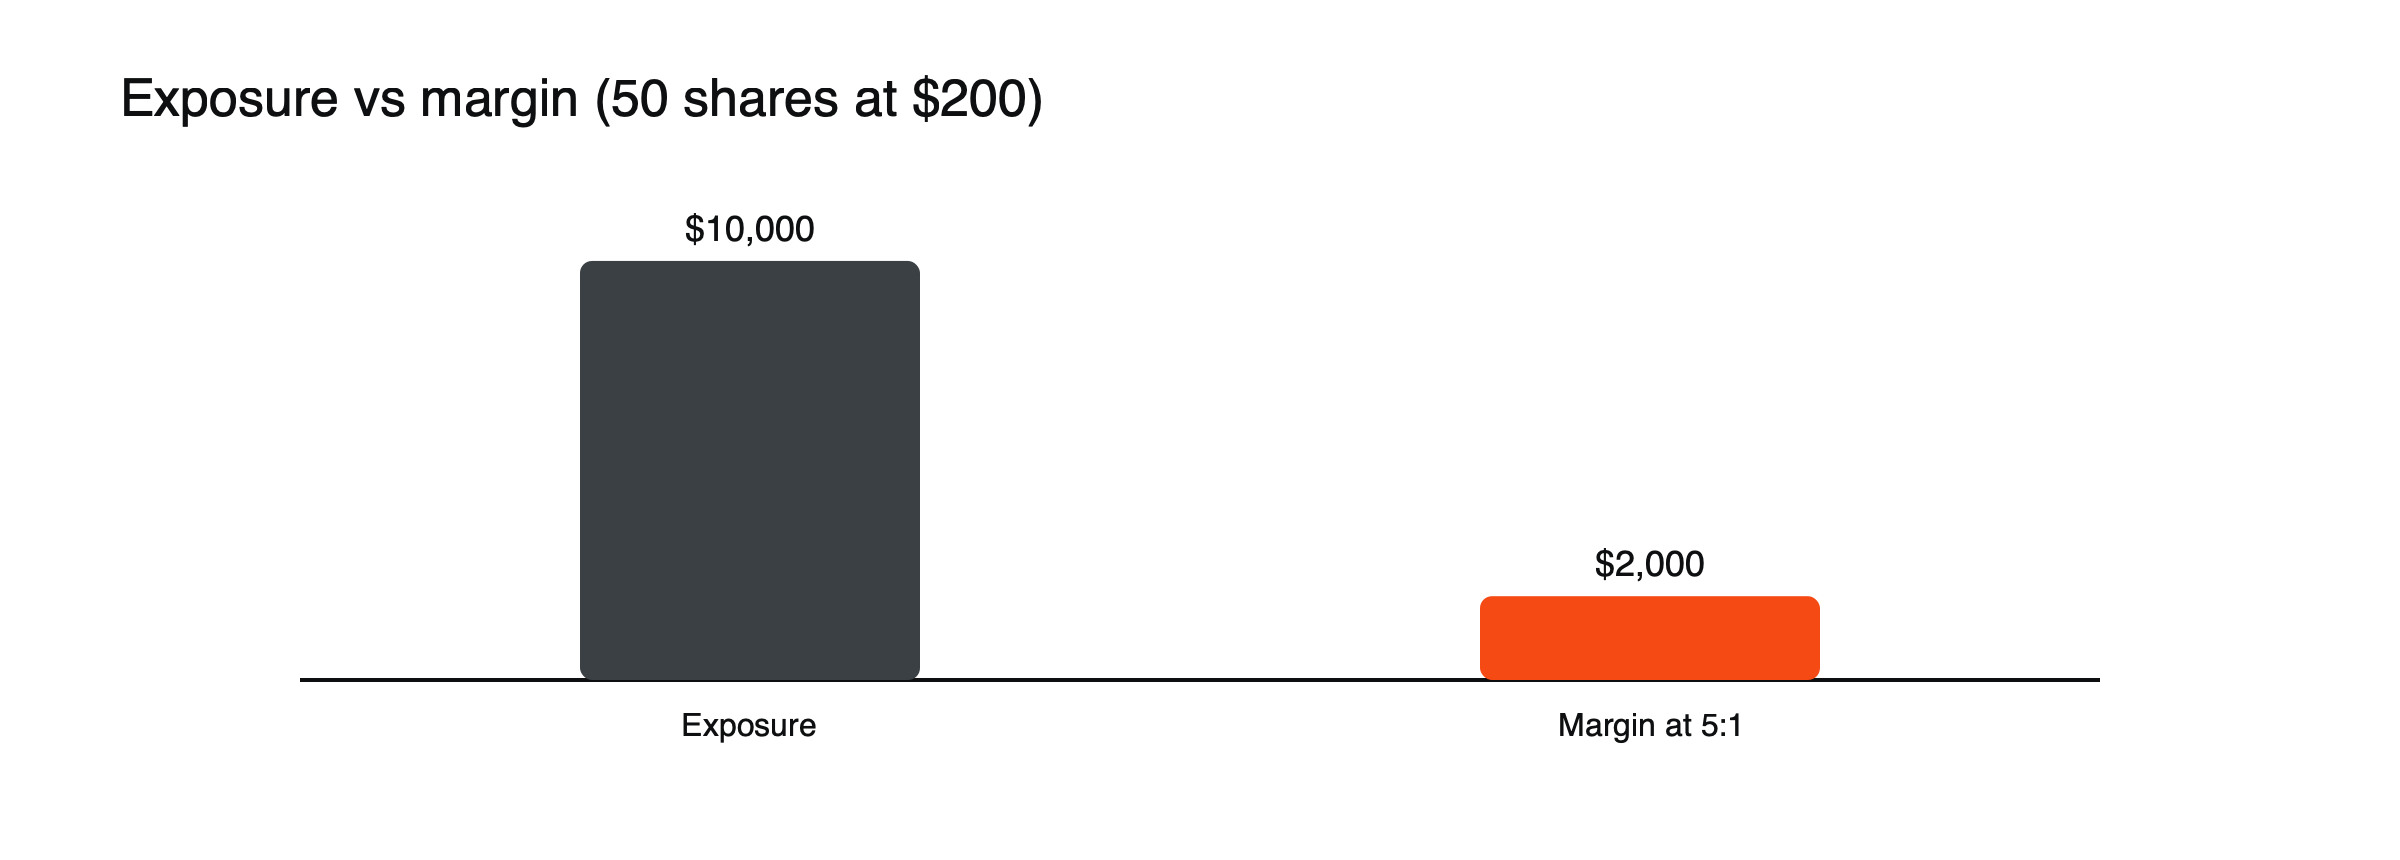
Figure: Exposure, not margin, drives profit and loss (example values).
| Share move | P&L | Share of margin |
|---|---|---|
| +1% | +$100 | +5% |
| −5% | −$500 | −25% |
| −20% | −$2,000 | −100% |
Worked example 2: a short position
- Short 60 CFD shares at $150
- Exposure: $9,000
- Margin at 5:1: $1,800
A 5% rise to $157.50 costs $450, a quarter of the margin. Exposure on a short is calculated the same way as on a long; only the direction of profit and loss changes. Because a share can rise without limit, exposure on a short grows as the price climbs, while on a long it shrinks as the price falls.
Currency conversion
If your account is in euros and the share is priced in dollars, convert: $10,000 at EUR/USD 1.10 is about €9,091. Currency moves then add to your profit or loss.
Worked example 3: a whole account
| Position | Direction | Exposure |
|---|---|---|
| Technology share A | Long | $10,000 |
| Technology share B | Long | $15,000 |
| Bank share C | Long | $8,000 |
| Retailer D | Short | $6,000 |
(Illustrative account.) Gross exposure, the sum of all positions regardless of direction, is $39,000. Net exposure, longs minus shorts, is $27,000. On an account with $10,000 of equity, that is about 3.9 times gross and 2.7 times net. A 5% fall in the whole market would cost roughly $1,350 on the net long exposure, before considering that the two technology shares may fall further than the market.
Effective leverage
Dividing total exposure by account equity gives effective leverage, a more useful measure than the maximum leverage the provider allows. The maximum is a limit on what can be opened; effective leverage shows what is actually being carried. Keeping it modest, for example below 2 or 3 times for shares, leaves room for gaps on earnings and market-wide sell-offs. See what leverage is in CFD trading.
Adding up total exposure
Sum exposure across all open stock CFDs, and note how much sits in one sector. Ten positions in technology shares can move together like one large position. See how currency correlations work for the same idea in forex.
Why it matters. Leverage hides how large a position really is; exposure shows it. See what leverage is in CFD trading, how to size a CFD position and how stock CFDs work.
Beta-adjusted exposure
Some shares move more than the market and some less. A share’s beta measures that sensitivity: a beta of 1.5 means it has tended to move about 1.5% for each 1% move in the market. Multiplying each position’s exposure by its beta gives beta-adjusted exposure, a rough estimate of how much the account would gain or lose in a market-wide move. Two positions with equal exposure can carry very different market risk. See what beta measures.
Exposure changes as prices move
Exposure is not fixed. A long position that rises becomes larger in value, so the same percentage move now produces a bigger profit or loss, and the position may need trimming to keep risk in line. A short that rises grows too, which is why losing shorts can become dangerous quickly. Rechecking exposure after large moves, not only when opening positions, keeps the account’s risk where you intend it.
Common errors
- Looking at margin used instead of exposure.
- Adding long and short exposures as if they cancel perfectly.
- Forgetting currency conversion for shares priced in other currencies.
- Ignoring sector concentration.
Worked example 4: an account in pounds
A trader with an account in pounds buys 100 CFD shares of a US company at $150. Exposure is $15,000, about £11,811 at GBP/USD 1.27. A 5% rise in the share adds about £591 in value, but if the dollar weakens against the pound by 5% during the trade, most of that gain disappears when converted back. For accounts in other currencies, exposure has two parts: the share and the exchange rate. (Illustrative figures.)
Exposure by sector
Grouping positions by sector shows concentrations that are easy to miss when looking at individual shares. In the account above, two of four positions, and nearly two-thirds of long exposure, are in technology. A sharp move in technology shares, for example on news about interest rates or regulation, would affect most of the account at once. Setting a maximum share of exposure for any one sector is a simple way to limit that risk.
Exposure and margin calls
Margin calls depend on equity relative to the margin used, but what moves equity is exposure. An account using only half its available margin can still be stopped out quickly if its exposure is concentrated in a few volatile shares that fall together. Watching exposure, rather than free margin alone, gives earlier warning of danger. See what margin calls and stop-outs are.
A weekly exposure check
Once a week, list every position with its exposure in your account currency, total the gross and net figures, divide by equity and note the largest sector and the largest single position. If any number is higher than your plan allows, reduce before the market does it for you.
Combining share and index positions
Many accounts hold both single-share CFDs and index CFDs. Because an index contains many of the same companies, a long index position adds to the market exposure of long share positions. A rough way to combine them is to add index exposure to beta-adjusted share exposure, which estimates how the whole account would respond to a market move. A trader who is long several large technology shares and also long a technology-heavy index may be far more exposed to that sector than either position suggests on its own. Checking the combined figure before adding any new position keeps overall market and sector exposure within the limits set in your trading plan.
Frequently asked questions
Is exposure the same as the money at risk?
It is the value the position tracks. The money at risk depends on how far the price moves and where your stop is, but exposure sets the size of every move.
Why does my platform show a different margin from my calculation?
Providers may set higher margin rates than the regulatory minimum for some shares, especially volatile or less liquid ones.
Leverage, margin and cost figures in this article are example values for illustration. Actual terms depend on the provider, the instrument and the rules in your country.
This article is educational content and does not constitute financial, investment, legal or tax advice. Digital assets are volatile and you may lose the amount you invest.