
How Government Shutdowns and Debt Ceiling Fights Have Affected Markets
US debt ceiling standoffs and credit downgrades have caused sharp but usually short sell-offs. What happened in 2011, 2023 and 2025, and why Treasuries rallied.
Debt ceiling fights and the credit downgrades that followed have caused sharp but mostly short-lived market reactions. After S&P removed the US AAA rating in August 2011, the S&P 500 fell 6.7% in a day, yet Treasuries rallied and stocks ended the year above their pre-downgrade level. Later downgrades by Fitch in 2023 and Moody’s in 2025 had smaller effects.
Timeline
- August 2, 2011: Congress raises the debt ceiling at the deadline.
- August 5, 2011: S&P downgrades the US to AA+.
- August 8, 2011: the S&P 500 falls 6.7%; the 10-year yield drops from 2.56% to 2.32% as investors buy Treasuries.
- October 2011: stocks are down 8.4% from before the downgrade, then recover; the year ends 4.8% higher.
- August 1, 2023: Fitch downgrades the US; stocks pull back about 10% over three months, amid rising yields and inflation worries.
- May 16, 2025: Moody’s removes the last AAA rating, citing deficits and rising debt.
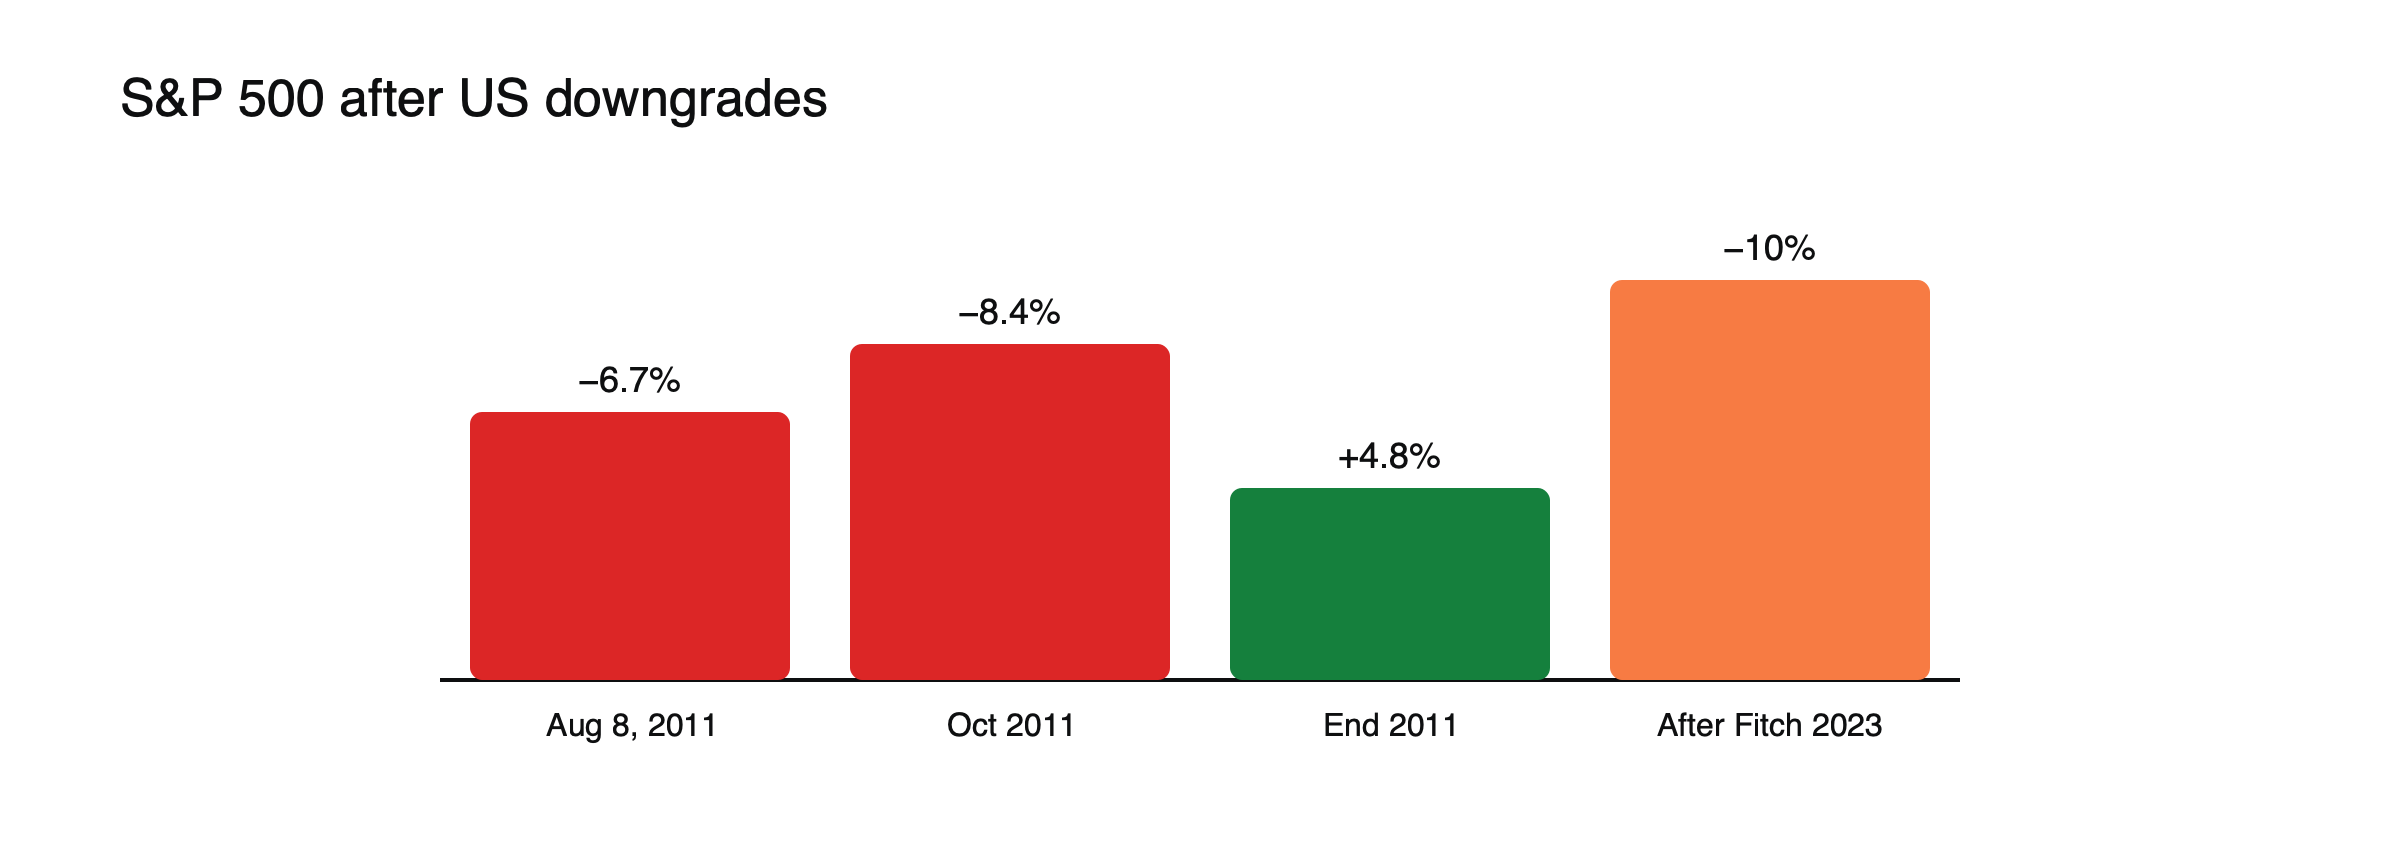
Figure: Sharp but short reactions. Sources: Cumberland Advisors; CME Group.
How the debt ceiling works
The US debt ceiling is a legal limit on how much the Treasury can borrow. Because the government runs deficits, it regularly reaches the limit and needs Congress to raise or suspend it. When negotiations drag on, the Treasury uses accounting measures to keep paying bills until a projected date, often called the X-date, after which it might be unable to pay all obligations. Markets focus on that date, because a missed payment on Treasuries would be unprecedented.
Bills near the X-date
As the X-date approaches, investors often avoid Treasury bills maturing around it, pushing their yields above those of bills maturing slightly earlier or later. These kinks in the bill curve, seen in 2011, 2013 and 2023, show where markets see the risk. Once a deal is struck, the kinks disappear, and the Treasury typically issues a wave of new bills to rebuild its cash balance, which can drain liquidity from markets for a time. See what quantitative tightening does to market liquidity.
Why Treasuries rallied
Even when the US was the source of the worry, investors still bought Treasuries as the deepest safe asset. The irony of 2011 was that the downgraded bonds were the main beneficiary.
Shutdowns
Government shutdowns delay data releases and some payments, adding uncertainty, but their direct market effects have usually been small and temporary.
The 2025 shutdown
From October 1 to November 12, 2025, the US government was shut down for 43 days, the longest shutdown in history. Many economic data releases were delayed or cancelled, leaving the Fed and markets with less information than usual for weeks. Share markets were largely unmoved by the shutdown itself, consistent with past episodes, but the data gap added uncertainty around rate decisions.
Why later downgrades mattered less
First shocks hit hardest; the Fitch and Moody’s downgrades had diminishing effects because markets had already lived through one.
Lessons
- Broader conditions, such as growth and inflation, decide how long a sell-off lasts.
- Long-term deficit trends matter more than any single standoff. See how fiscal deficits affect rates, currencies and stocks , why central bank independence matters to markets and how recession signals have performed.
At a glance
| Event | Market reaction |
|---|---|
| August 2011 debt ceiling and S&P downgrade | S&P 500 −6.7% on August 8; Treasuries rallied |
| October 2013 shutdown | Short-lived volatility |
| August 2023 Fitch downgrade | About 10% pullback over three months, with rising yields |
| May 2025 Moody’s downgrade | Limited reaction |
| October–November 2025 shutdown | Largely unmoved; data delays |
A downgrade day, illustrated
Suppose a rating agency downgrades a major government after a debt standoff. (Illustrative scenario.) Shares may fall 3% to 5% on the day as investors cut risk, gold rises and, paradoxically, the downgraded government’s bonds rally as investors seek the most liquid safe asset available. Over the following weeks, the market’s direction depends more on growth, inflation and central bank policy than on the downgrade itself.
Lessons for traders
Debt ceiling standoffs and shutdowns create headline risk and occasional sharp moves, but their lasting effects have been limited. Traders can reduce exposure ahead of known deadlines, watch bill yields around the X-date for signs of stress and avoid assuming that a downgrade will trigger a lasting sell-off.
The 2023 standoff
In 2023, the debt ceiling was reached in January, and negotiations ran until early June, close to the Treasury’s projected X-date. Bill yields around that date rose, and some investors bought protection against a US default in derivative markets. Congress suspended the limit in early June, and the Treasury then issued large amounts of bills to rebuild its cash. Two months later, Fitch downgraded the US, citing repeated debt-limit standoffs and rising debt.
Insurance against default
Investors can buy credit default swaps on US government debt, contracts that pay out in the event of default. Their prices rise during debt ceiling fights, signaling how much protection investors want, even though most see an actual default as very unlikely. The rise in these prices is often a better gauge of market concern than share prices.
Gold and the dollar during standoffs
Gold has sometimes risen during debt standoffs and after downgrades, as investors seek an asset with no default risk. The dollar’s reaction has been mixed: concern about US governance can weigh on it, while safe-haven demand in a broad sell-off can support it. See Bitcoin, gold and the dollar under market stress.
Shutdowns and data
During shutdowns, agencies that publish economic data may stop work, delaying reports on jobs and inflation. Markets then trade with less information, and private data sources gain importance. Data releases resume after a shutdown, sometimes with gaps.
Common misreadings
- Treating every standoff as a real default threat.
- Assuming downgrades cause lasting sell-offs.
Why the limit keeps coming back
Because the government spends more than it collects in taxes, its debt rises every year, and the ceiling must be raised regularly. Raising it does not authorize new spending; it allows the Treasury to pay for spending Congress has already approved. Yet the vote gives lawmakers leverage in budget negotiations, which is why standoffs recur. Some economists have proposed abolishing the limit, but it remains in place.
The bigger fiscal picture
Debt ceiling fights draw attention, but long-term deficits and rising interest costs matter more for markets. Rating agencies cited both the repeated standoffs and the growing debt burden when downgrading the US in 2011, 2023 and 2025. Investors watch deficit projections, Treasury issuance plans and auction demand for signs that borrowing is pushing up long-term yields. See how fiscal deficits affect rates, currencies and stocks.
Rebuilding the Treasury’s cash, illustrated
Suppose the Treasury’s cash balance has fallen to $50 billion during a standoff and it aims to rebuild it to $750 billion after the limit is lifted. (Illustrative figures.) It must sell about $700 billion of extra bills within weeks. Money market funds and banks buy them, drawing cash from elsewhere in the financial system. That temporary drain can tighten liquidity and weigh on risk assets, an effect markets watched closely after the 2023 deal.
Shutdown history
The US government has shut down several times since the 1990s, including for 16 days in 2013, 35 days in 2018 and 2019 and 43 days in 2025, the longest on record.
Before a deadline
Traders watch Treasury estimates of the X-date, bill yields around it, default protection prices and progress in negotiations.
Why markets mostly shrug
Markets have learned that debt ceiling fights almost always end with a deal, often at the last minute. That experience limits the reaction to most standoffs, with sharper moves reserved for moments when a deal looks genuinely at risk, as in 2011. The danger is complacency: if a deadline were ever missed, the reaction could be far larger than in any past episode, because Treasuries sit at the center of the global financial system and are used as collateral in countless transactions.
Bills, repo and the X-date
Treasury bills are used as collateral in short-term funding markets. Around the X-date, some lenders become reluctant to accept bills maturing near it, which can tighten funding conditions. Central banks and regulators monitor these markets closely during standoffs, ready to act if stress spreads.
Frequently asked questions
Has the US ever missed a debt payment?
No. Congress has always raised or suspended the limit before a default.
Why do downgraded Treasuries still rally?
Because no other market offers the same size, liquidity and safety, so investors still turn to them in times of stress.
This article is educational content and does not constitute financial, investment, legal or tax advice. Digital assets are volatile and you may lose the amount you invest.
Sources
- US Downgrade Then and Now (S&P 500 −6.7% on August 8, 2011; −8.4% by October; +4.8% by year end; 10-year from 2.56% to 2.32%; diminishing effects of later downgrades) — Cumberland Advisors, May 2025
- What history reveals about US debt downgrades (Fitch August 1, 2023; about 10% pullback over three months) — CME Group, 2025
- US downgrade: Not the first time (Budget Control Act at the August 2, 2011 deadline) — Metrobank Wealth Insights
- Taking a closer look at the US downgrade (Moody’s downgrade on May 16, 2025) — Cumberland Advisors, June 2025
- Federal Update: Government shutdown ends (House voted on November 12, 2025, to reopen the government after 43 days, the longest shutdown in history) — IASB, November 2025