
How MVRV Is Calculated and How Traders Read It
MVRV compares bitcoin's market value with what holders paid. The formula, a worked example, what readings above 3.5 and below 1 have meant, and its limits.

MVRV, market value to realized value, compares bitcoin’s market cap with its realized cap, a rough measure of what holders paid: MVRV = market cap ÷ realized cap, or price ÷ realized price. Above 1, the average holder is in profit; below 1, at a loss. Readings in the high 3s have come near past tops, below 1 near bottoms.
The formula
Market cap = price × circulating supply
Realized cap = the sum of each coin valued at the price when it last moved on-chain
MVRV = market cap ÷ realized cap = price ÷ realized price
See how bitcoin’s realized price is calculated.
Worked example
Supply 19.9 million BTC, price $100,000, realized cap $900 billion (illustrative).
- Market cap = 19.9 million × $100,000 = $1.99 trillion
- Realized price = $900 billion ÷ 19.9 million ≈ $45,226
- MVRV = $1.99 trillion ÷ $900 billion ≈ 2.21
The average coin is worth about 2.2 times what it cost when it last moved: holders sit on large unrealized profits.
What realized cap actually measures
Market cap values every coin at today’s price. Realized cap values each coin at the price when it last moved on the blockchain, so a coin bought at $20,000 and never moved since still counts at $20,000. The result approximates the total cost basis of all holders, or the amount of money that has gone into the coins at their latest transfer. When realized cap rises, coins are changing hands at higher prices; when it falls, they are changing hands at lower ones.
A second example: a bear market
Suppose bitcoin trades at $30,000 while the realized price is $35,000. (Illustrative.) MVRV is 30,000 ÷ 35,000 ≈ 0.86: the average coin is worth less than it cost when it last moved, and the typical holder is sitting on a loss. Readings like this have historically appeared late in bear markets, when the remaining holders are those least willing to sell.
How traders read it
| MVRV | What it means | Historical context |
|---|---|---|
| Below 1 | Average holder at a loss | Near past bear-market bottoms |
| 1 to about 2 | Moderate profit | Common in recoveries |
| Above about 3.5 | Very large unrealized profit | Near past cycle tops |
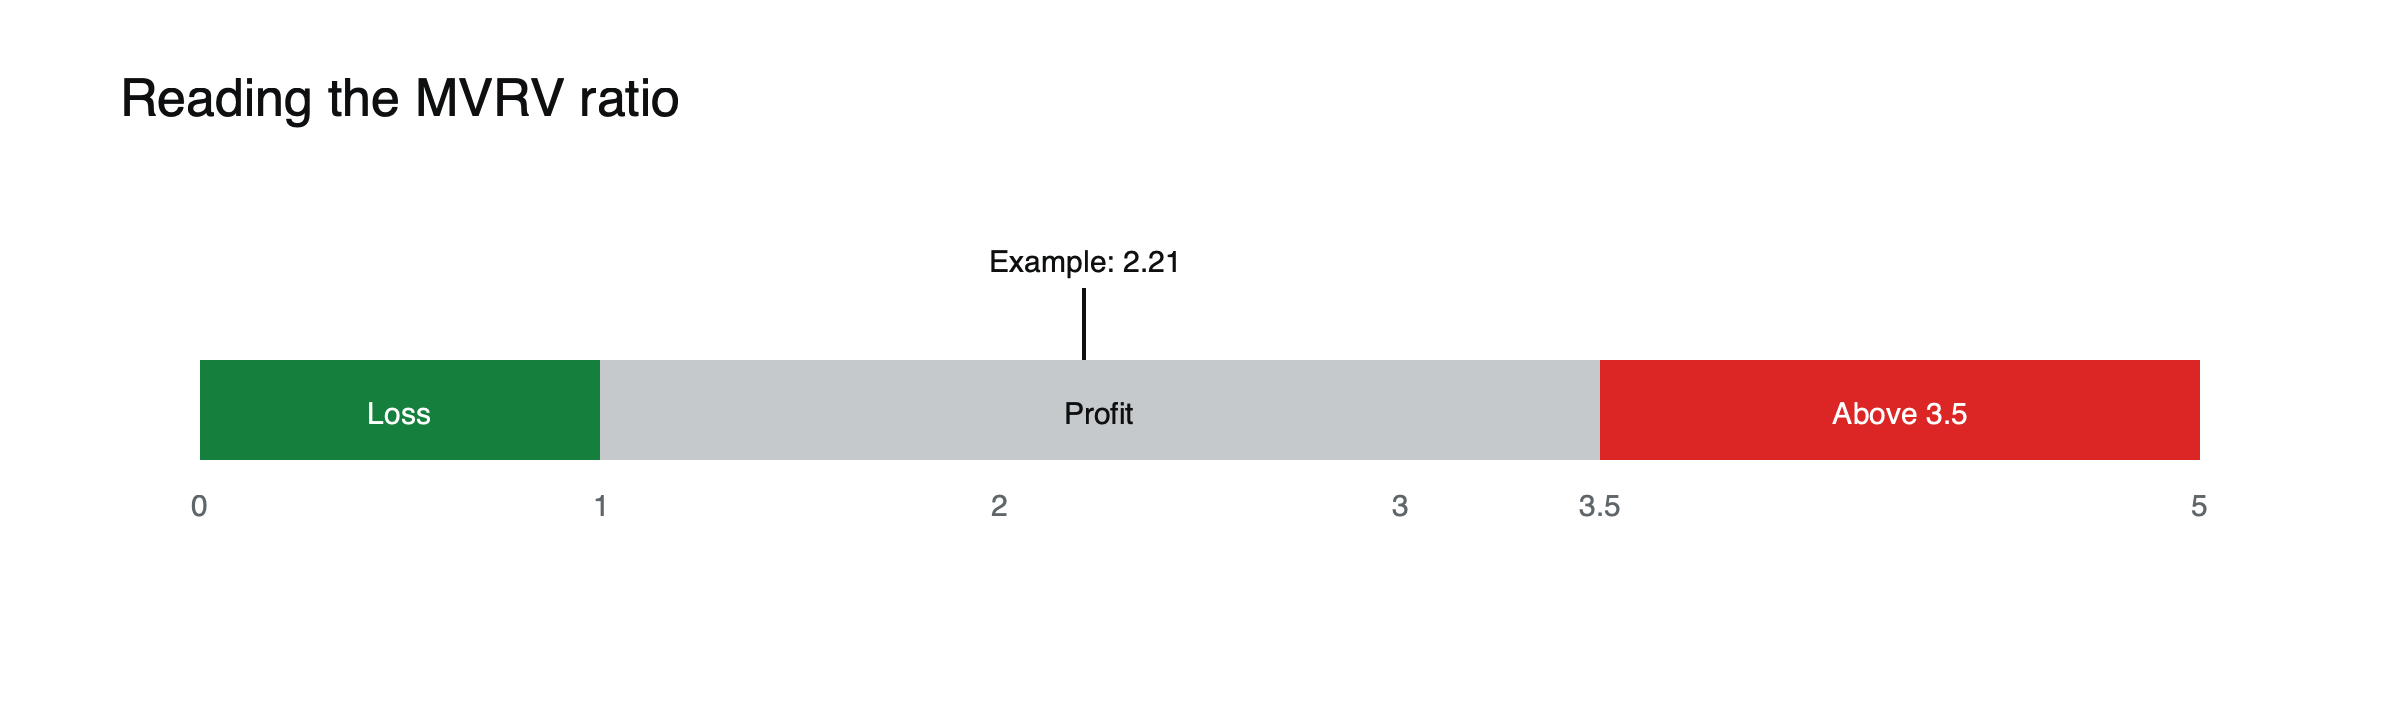
Figure: Where the worked example (MVRV ≈ 2.21) falls. Thresholds are historical, not fixed.
Analysts at K33 noted bitcoin’s MVRV reached 3.7 in March 2013 and February 2021, both during strong rallies. CryptoQuant uses 3.7 and 1 as its reference thresholds.
Why the peaks keep getting lower
MVRV peaks have been lower in each cycle, and there are reasons to expect that to continue. As bitcoin’s market grows, its realized cap rises too, because more coins have changed hands at higher prices; the same rally then produces a smaller ratio. A larger share of supply now sits with long-term holders, funds and companies that trade less often, and spot ETFs and derivatives let investors gain exposure without moving coins on-chain at all. Waiting for the reading of 3.7 seen in 2013 and 2021 could therefore mean waiting for a level the market no longer reaches.
Reading MVRV on a chart
Most charts show MVRV as a line over time, often with shaded bands for historically high and low zones, and some plot bitcoin’s price alongside its realized price instead. The two views carry the same information: when price is far above realized price, MVRV is high. What matters on either chart is how far the reading is from its own history and how long it stays there. Markets have spent months in high zones before topping and in low zones before recovering.
Variations on the metric
MVRV Z-score measures how far market cap is from realized cap relative to the usual volatility of market cap, making extremes easier to compare across periods.
Short-term and long-term holder MVRV split the calculation by how long coins have been held. Short-term holders, often recent buyers, tend to react quickly to price swings, so their MVRV moving below 1 can signal capitulation among newer participants even while long-term holders remain in profit.
Using it in practice
MVRV works best as context. A high reading says many holders have large unrealized profits and could sell into rallies; a low reading says many are under water and selling pressure may be nearly exhausted. Traders often combine it with exchange flows and holder-behavior metrics rather than acting on it alone, and treat round-number thresholds as zones rather than lines.
Common mistakes with MVRV
- Treating thresholds as exact. A reading of 3.4 is not safe because it is below 3.5, nor is 1.05 a sign that the bottom has passed.
- Ignoring time. Extreme readings can persist, and selling at the first high reading has often meant missing the rest of a rally.
- Comparing across coins. A ratio of 2 means different things for bitcoin and for a token with concentrated holders and a short history.
- Forgetting lost coins. Coins that will never move again stay in realized cap at old prices, which lowers realized cap and lifts the ratio slightly over time.
Calculating it yourself
The formula is simple, but realized cap requires a full history of every coin’s last movement, which is why most people take it from an analytics provider. With realized cap in hand, divide market cap by it, or divide price by realized price; both give the same answer. Results also depend slightly on the data source.
Limits
- Peaks have been lower each cycle, so a fixed threshold may never be hit again.
- Lost coins stay priced at old values in realized cap, distorting it.
- Off-chain activity, such as ETF and exchange trading, is not reflected in when coins move.
- Few cycles: a handful of data points is a small sample.
Use MVRV as context for how stretched the market is, not as a trading signal on its own. See on-chain metrics traders misread and what on-chain analysis is.
This article is educational content and does not constitute financial, investment, legal or tax advice. Digital assets are volatile and you may lose the amount you invest.
Frequently asked questions
Does MVRV work for coins other than bitcoin?
It can be calculated for any coin with public transaction history, including ether, but it is most studied for bitcoin, which has the longest record. For smaller tokens, concentrated holdings and short histories make the readings less meaningful.
Where can I see MVRV?
Several on-chain analytics providers publish MVRV charts, some for free. Values can differ slightly between providers because they treat lost coins, exchange wallets and data cleaning differently.
Sources
- MVRV Ratio (definition; realized cap as cost basis) — Glassnode documentation
- Using MVRV to estimate tops and bottoms (MVRV hit 3.7 in March 2013 and February 2021; below 1 means market cap under cost basis) — K33 Research
- MVRV Ratio (3.7 and 1 thresholds) — CryptoQuant Data Guide
- MVRV Ratio (peak values declined each cycle) — Spark
- MVRV Z-Score (deviation of market value from realized value relative to its standard deviation) — Glassnode documentation