
How Quantitative Easing Changed Markets After 2008
From 2008 to 2022, Fed bond buying grew its balance sheet from under trillion to about trillion. The QE timeline and what it did to rates and markets.
Quantitative easing (QE) is large-scale bond buying by a central bank to push down long-term rates when policy rates are near zero. After 2008, successive rounds grew the Fed’s balance sheet from under $1 trillion to about $9 trillion by 2022. QE lowered borrowing costs, damped volatility and coincided with a long rise in asset prices.
Timeline
- November 2008 (QE1): purchases begin after the Lehman collapse; by June 2010 the balance sheet reaches about $2.3 trillion.
- November 2010 (QE2): $600 billion of Treasury purchases; about $2.8 trillion by mid-2011.
- September 2012 (QE3): open-ended buying of $85 billion a month; about $4.5 trillion by 2014.
- 2017–2019: first round of tightening.
- March 2020: pandemic QE adds trillions within months.
- 2022: the balance sheet peaks near $9 trillion; purchases end in March and tightening begins.
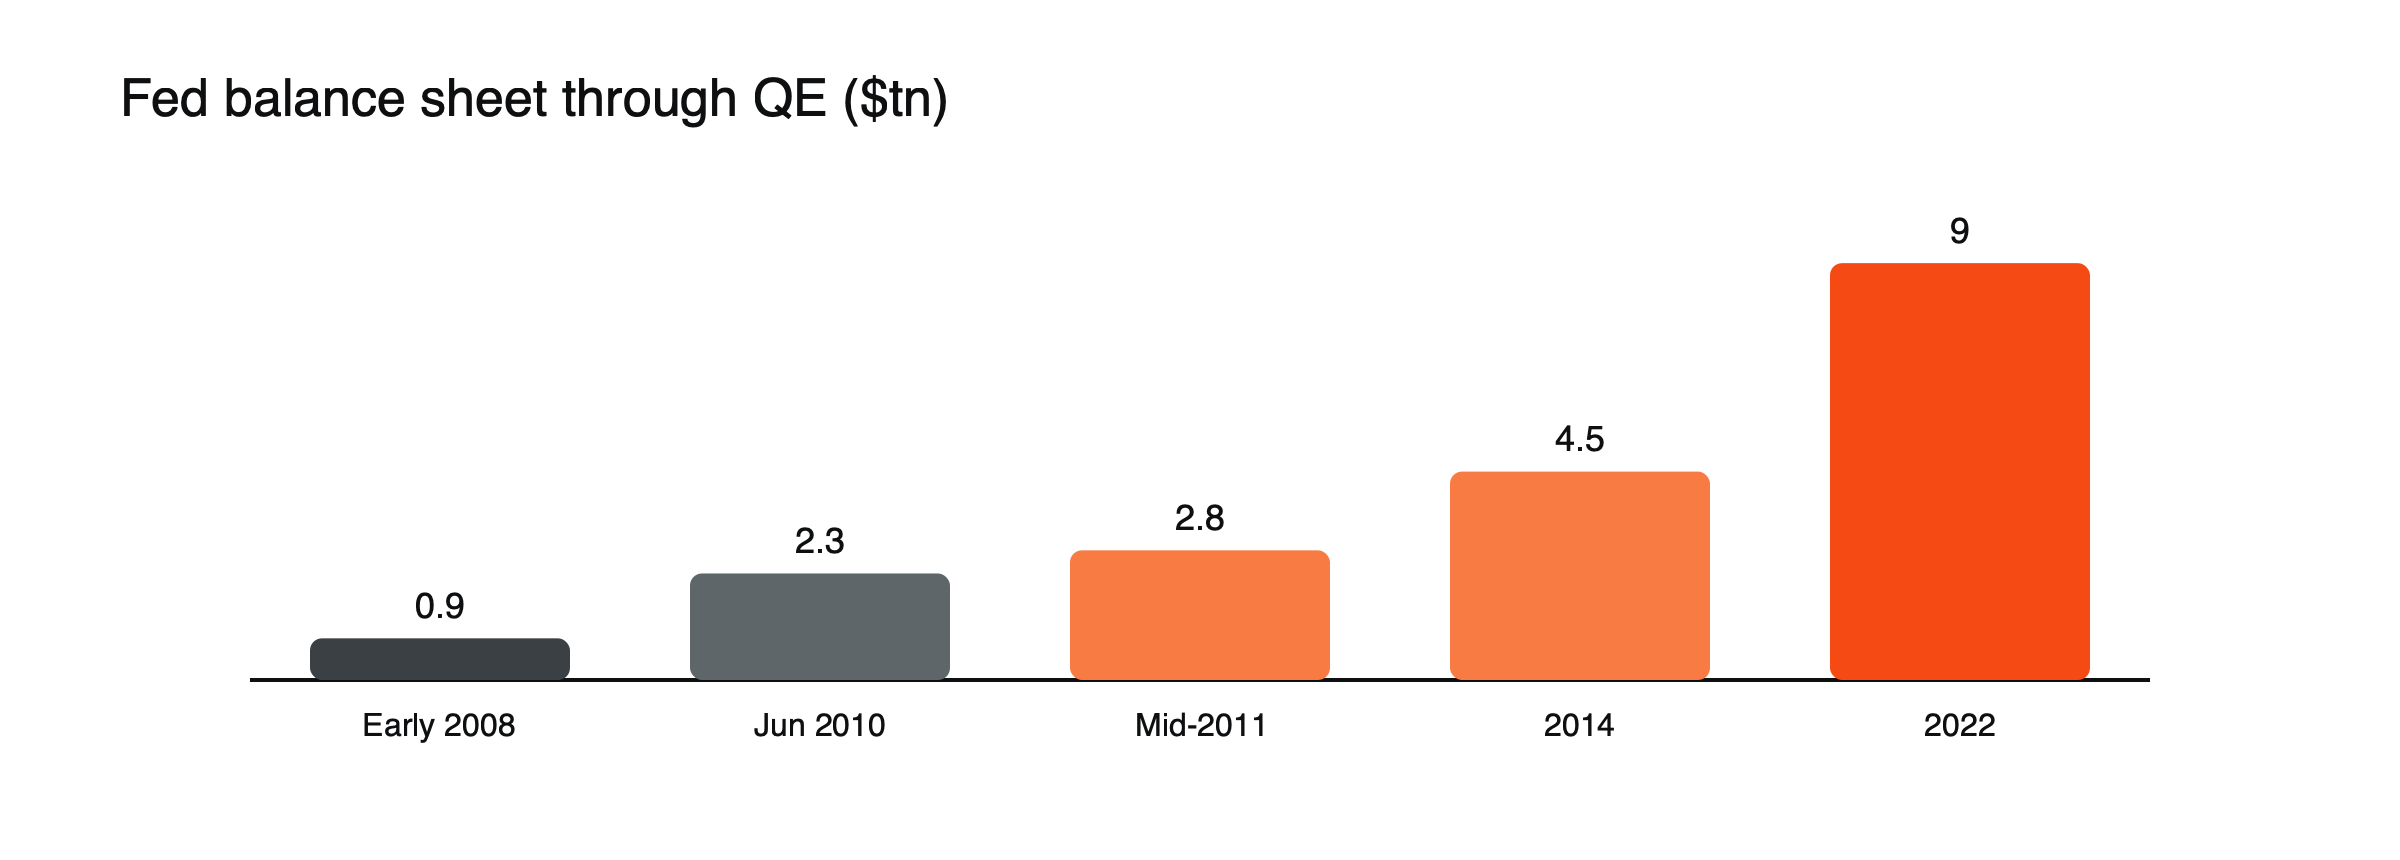
Figure: The Fed balance sheet through QE rounds ($ trillions). Sources: MUFG; Quoth the Raven.
How QE works
The central bank creates new reserves and uses them to buy government bonds, and sometimes mortgage or corporate bonds, from banks and investors. The purchases push bond prices up and yields down, especially for longer maturities. Sellers receive cash, which many reinvest in other assets such as corporate bonds or shares, pushing their prices up too. QE also signals that the central bank intends to keep policy loose for a long time, which lowers expectations for future rates.
QE around the world
The Fed was not alone. The Bank of Japan had experimented with quantitative easing in the early 2000s and expanded it massively from 2013. The Bank of England began buying gilts in 2009, and the European Central Bank launched large-scale purchases in 2015, later adding a pandemic program in 2020. By the early 2020s, central banks together held a large share of their governments’ bonds. See why the Bank of Japan ended yield curve control.
What QE did
- Rates: lowered long-term yields and term premiums.
- Risk assets: encouraged investors to move into stocks, credit and other assets for higher returns.
- Volatility: suppressed for long stretches.
- The economy: modest support for growth and inflation, larger if compared with doing nothing.
The QE trade, illustrated
Suppose a pension fund holds 10-year government bonds yielding 3% and the central bank’s purchases push the yield to 2%. (Illustrative scenario.) The fund sells some bonds to the central bank at higher prices and looks for other assets paying more. It buys corporate bonds, pushing their yields down too, and adds shares paying dividends of 3%. Repeated across thousands of investors, this search for yield lifts prices across markets, one of the main channels through which QE supports the economy and asset prices.
The case for QE
Supporters credit QE with preventing deeper crises in 2008 and 2020.
The case against
Critics argue it inflated asset prices, widened wealth gaps and made markets dependent on central bank support. The 2021–2022 inflation renewed questions about its side effects.
QE and inflation
For most of the 2010s, QE did not produce high inflation, surprising critics who expected it would. Inflation stayed low partly because banks held the new reserves rather than lending them all out and because other forces kept prices down. In 2020 and 2021, however, massive QE combined with large government spending and supply shocks, and inflation surged. The episode revived the debate over whether QE becomes more inflationary when paired with heavy fiscal stimulus.
QE and markets, at a glance
| Period | Program | Market backdrop |
|---|---|---|
| 2008–2010 | QE1 | Crisis recovery; shares bottom in March 2009 |
| 2010–2011 | QE2 | Recovery continues; commodities rise |
| 2012–2014 | QE3 | Shares rally; 2013 taper tantrum |
| 2020–2022 | Pandemic QE | Rapid recovery; boom in tech and crypto |
The reverse
Shrinking the balance sheet, quantitative tightening, has proved harder to calibrate. See what quantitative tightening does to market liquidity, why the Bank of Japan ended yield curve control and what markets listen for in a central bank meeting.
The taper tantrum
When the Fed signaled in 2013 that it might slow QE3, the 10-year Treasury yield rose from about 2% in May to about 3% by December, emerging market currencies fell and gold slid. The episode showed how dependent markets had become on QE and how carefully central banks would need to communicate its end. See what the 2013 taper tantrum was.
Lessons for traders
QE periods favored long positions in shares, bonds and other risk assets, while announcements of slower buying or balance sheet reductions often triggered sell-offs. Traders learned to watch central bank balance sheets as well as interest rates. In the next crisis, renewed QE is likely to be one of the first tools used, and markets may react quickly to any hint of it.
QE and the dollar
Fed QE tended to weaken the dollar by lowering US yields and increasing the supply of dollars, while QE by other central banks, such as the ECB from 2015, tended to weaken their currencies against the dollar. Relative QE programs therefore shaped currency trends across the 2010s. See how a strong dollar hits commodities, emerging markets and crypto.
QE and bank reserves
QE greatly increased the reserves banks hold at the central bank. Abundant reserves kept funding markets calm and changed how central banks set interest rates, by paying interest on reserves rather than adjusting their scarcity. Shrinking reserves later, through QT, proved delicate. See what quantitative tightening does to market liquidity.
QE and inequality
Because QE lifted the prices of shares, bonds and property, it benefited people who already owned those assets more than those who did not. Critics argue it widened wealth gaps; supporters respond that the alternative, a deeper recession with higher unemployment, would have hurt lower-income households more.
QE and crypto
The pandemic QE of 2020 and 2021 coincided with a boom in crypto and speculative assets, as cheap money and low yields encouraged investors to take more risk. When QE ended and rates rose in 2022, those assets fell sharply.
Common misreadings
- Assuming QE always causes high inflation.
- Believing QE only affects bond markets.
Yield curve control
The Bank of Japan took QE a step further from 2016 by targeting the 10-year government bond yield directly, buying as many bonds as needed to keep it near its target, a policy called yield curve control. It loosened the policy in stages from late 2022 and largely abandoned it in 2024. The experiment showed both how powerful central bank buying can be and how hard it is to exit.
QE in the next crisis
Central banks have used QE in every major crisis since 2008 and are likely to use it again. Because markets know this, they may react quickly to signs of renewed bond buying, rallying on the expectation of support. But with inflation higher than in the 2010s, central banks may be more cautious about launching large programs, which could make future crises harder to calm.
Measuring QE’s effects
Economists estimate QE’s effects by looking at market moves around announcements and by modeling how much it lowered yields and term premiums. Estimates vary widely, but most find that early programs, announced during crises, had the largest effects, while later rounds mattered less as markets came to expect them.
QE and volatility
By acting as a large, predictable buyer, central banks dampened volatility in bond markets for long stretches. Lower volatility encouraged investors to take more risk and use more leverage.
QE and corporate borrowing
Lower long-term yields allowed companies to borrow cheaply for years, refinancing debt at low fixed rates. Many used the money for investment, but some funded share buybacks and acquisitions. When rates rose after 2022, companies that had locked in long-term debt were protected for a while, which helps explain why higher rates took time to affect corporate finances. The delay surprised some investors who expected a much quicker squeeze on corporate profits and margins.
Frequently asked questions
Is QE the same as printing money?
It creates central bank reserves, but those are used to buy bonds rather than handed out, so its effect on spending is indirect.
Did QE cause the 2021–2022 inflation?
It contributed alongside fiscal stimulus and supply shocks; economists still debate how much.
This article is educational content and does not constitute financial, investment, legal or tax advice. Digital assets are volatile and you may lose the amount you invest.
Sources
- The End of QT (QE1 December 2008, QE2 November 2010, QE3 September 2012, COVID QE March 2020; under $1 trillion to $9 trillion; effects on premia, volatility and asset prices) — MUFG, December 2025
- The Fed’s Balance Sheet Feeds Bailout Culture (QE1 to $2.3 trillion by June 2010; QE2 to about $2.8 trillion; QE3 to $4.5 trillion) — Quoth the Raven
- QE and QT periods (QE1 November 25, 2008; QE2 $600 billion; QE3 $85 billion a month) — TradingView script notes
- No taper tantrum this time? (10-year yield from about 2% in May 2013 to about 3% in December) — FRED Blog, St. Louis Fed
- Bank of Japan raised rates for the first time in 17 years (YCC since 2016; band widened at end-2022; YCC largely abandoned in 2024) — The Conference Board, March 2024