
What Is Tokenomics?
Tokenomics is the economics of a crypto token: supply, who holds it, how tokens are issued or burned and what creates demand. What to check and why it matters.
Tokenomics is the economics of a crypto token: how many tokens exist and will exist, who holds them, how new tokens are created or destroyed and what gives people a reason to hold or use them. Two tokens with the same price can have very different prospects because of it, so check it before buying.
Why tokenomics changes the picture
A token’s price alone says almost nothing. Consider two tokens, each trading at $1. (Illustrative figures.)
| Token A | Token B | |
|---|---|---|
| Price | $1 | $1 |
| Circulating supply | 100 million | 900 million |
| Total supply | 1 billion | 1 billion |
| Market cap | $100 million | $900 million |
| Fully diluted valuation | $1 billion | $1 billion |
Token A looks small, but 900 million more tokens are waiting to be released, nine times what trades today. Every one of those tokens is a potential sale. Token B already has nearly all of its supply in the market. Same price, same eventual size, very different risk of new selling. Tokenomics is how you tell them apart.
The four building blocks
Supply
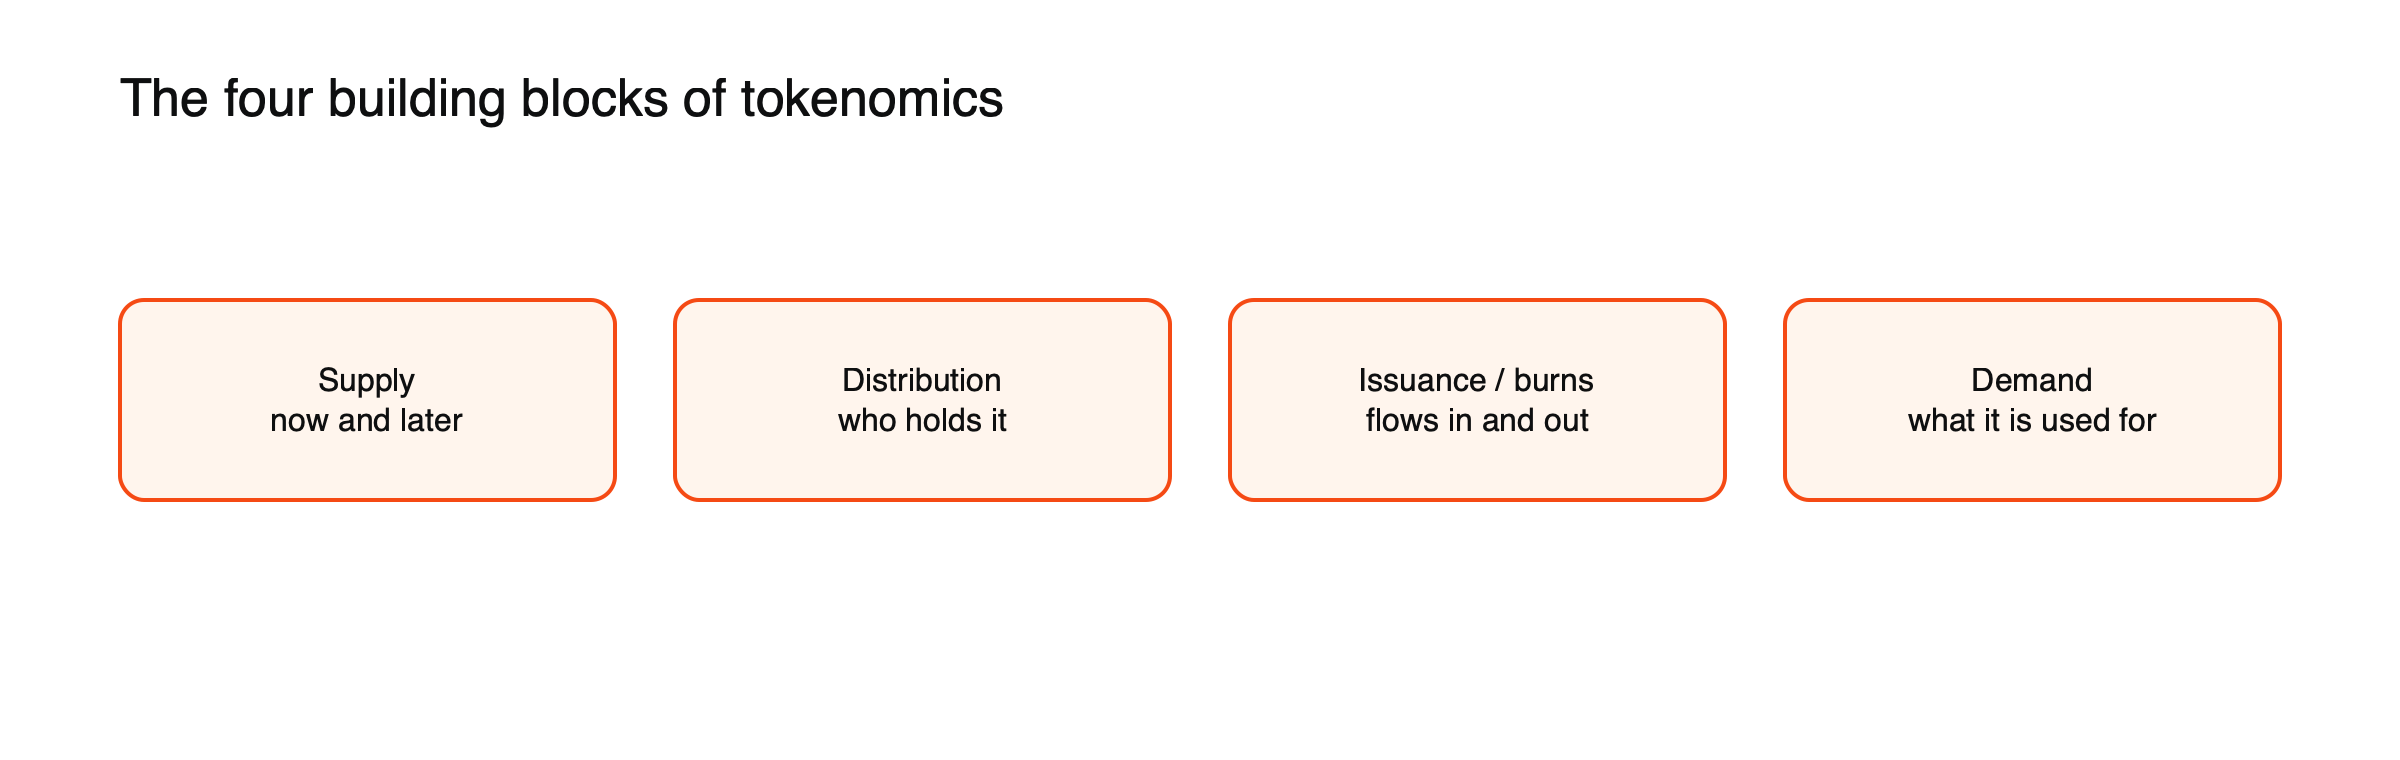
Figure: The four things to check in any token’s economics.
Circulating supply is what can trade today. Total supply counts every token that exists, including locked ones. Maximum supply is the cap, if there is one. The gap between circulating and total supply is future supply, and the schedule for releasing it matters as much as its size. A token with 20% circulating and the rest unlocking over ten years behaves very differently from one where the same amount unlocks in twelve months.
Distribution
Who received tokens at launch shapes who can sell and who controls votes. A typical allocation splits supply among the team, early investors, a community or ecosystem fund, a treasury and sometimes a public sale or airdrop. Large shares for insiders, especially with short lockups, put a few wallets in control of price and governance. Concentration can be checked on a blockchain explorer by looking at the largest holders, after excluding exchange and contract addresses.
Issuance and burning
Some tokens create new units on a schedule, as mining or staking rewards or as incentives for users. Others destroy units through fees, buybacks or burns. The net of the two is the token’s real inflation or deflation rate: new tokens per year minus tokens destroyed, divided by circulating supply. A token issuing 10% a year needs demand to grow 10% a year just to hold its price. See inflationary vs deflationary tokens.
Demand and utility
What the token is used for decides whether anyone needs to hold it. Common uses include paying network fees, staking to secure a network, voting on protocol changes and serving as collateral. Use that depends on real activity tends to last; demand that exists only because the token pays rewards in more of itself tends to fade when rewards fall.
Different kinds of token, different questions
Tokenomics questions depend on what a token is for:
- Native network coins, such as bitcoin or ether, pay for transactions and secure the chain, so issuance, fees and security budgets matter most.
- Governance tokens give votes over a protocol. Their value depends on whether that control includes fees or treasury assets, or only influence.
- Utility tokens unlock a service, such as storage or computing. The key question is whether users must actually hold the token or can pay in something else.
- Stablecoins aim to hold a fixed value, so reserves and redemption replace supply schedules as the main concern. See what a stablecoin is.
- Memecoins usually have no utility at all, so distribution and holder concentration dominate.
Emissions and incentive programs
Many protocols pay users in new tokens to provide liquidity, borrow, lend or simply use the product. These incentives can attract activity quickly, but much of it leaves when rewards fall: users who arrived for the rewards tend to sell them as soon as they receive them. A protocol whose usage collapses when incentives end has bought temporary activity with permanent dilution. Comparing activity and fees before and after reward cuts is one of the clearest tests of real demand.
Vesting, cliffs and unlocks
Tokens allocated to teams and investors are usually locked and released over time. A cliff is a period during which nothing unlocks; vesting is the gradual release that follows.
Suppose a project gives its team 200 million tokens with a one-year cliff and three years of monthly vesting. Nothing reaches the market for twelve months; after that, about 5.6 million tokens unlock every month for 36 months. (Illustrative figures.) Whether that monthly amount matters depends on how much trades each day. If daily volume is a few million tokens, each unlock can equal days of normal trading.
Unlocks are not automatic sales, but they often bring selling. A study of more than 16,000 unlock events by the market maker Keyrock found about 90% were followed by negative price pressure, often beginning weeks before the unlock date as traders positioned in advance. See what token unlocks and vesting schedules are.
Value accrual: does using the network help the token?
A protocol can be popular while its token gains little from that popularity. Value accrual describes the link between activity and the token. Strong links include fees that are burned, used to buy back tokens or paid to stakers. Weak links include tokens used only for governance votes, or rewards paid entirely by issuing new tokens. A useful distinction is between yield that comes from fees users actually pay and yield that comes from inflation, which dilutes everyone who does not claim it.
Treasury and governance
Many projects hold a large treasury of their own tokens, controlled by a team, a foundation or token-holder votes. The treasury can fund development for years, or be sold to cover costs. Governance decides how it is spent and can also change emissions, fees and unlock rules. That flexibility is useful, but it means the published tokenomics are a current plan rather than a permanent rule, especially when a small group holds most voting power.
How tokenomics shows up in the price over time
A common pattern runs like this. A token launches with a small share of its supply in circulation and a high valuation, supported by early excitement and limited supply. As cliffs end and vesting begins, new tokens arrive every month. Unless demand grows at least as fast, the price drifts lower even if the project is doing well, because each unlock adds sellers. Tokens that launch with most of their supply already circulating avoid this overhang but often start at lower valuations. Neither path guarantees a result, but the schedule tells you which headwinds a token faces.
Market cap vs fully diluted valuation
Market cap multiplies the price by circulating supply. Fully diluted valuation (FDV) multiplies it by the total supply that will eventually exist. A large gap between the two shows how much new supply is still to come. A low market cap with a very high FDV often means a token launched with a small float and a high price, leaving early holders and later buyers on opposite sides of future unlocks. See what crypto market cap is.
Examples
- Bitcoin: a fixed 21 million cap with issuance halving about every four years, and no allocation to founders or investors. See what the bitcoin halving is.
- Dogecoin: about 5 billion new coins a year with no cap, so its inflation rate falls slowly as supply grows. See what Dogecoin is.
- BNB: started at 200 million tokens and burns tokens toward a 100 million target. See what BNB is.
- Ether: no hard cap, with new issuance to validators offset by a fee burn that varies with activity. See how the ETH burn works.
Red flags
- A small circulating share with large unlocks in the next year.
- Team and investor allocations above about half of supply, or short lockups.
- Rewards paid only in the token itself, with no fees behind them.
- A few wallets, other than exchanges and contracts, holding most of the supply.
- Admin keys able to mint new tokens without limits or delays.
- Tokenomics that are hard to find, vague or recently changed without explanation.
How to read a token’s tokenomics in ten minutes
- Note circulating, total and maximum supply from a data site and from the project’s own documents; check that they agree.
- Find the allocation and vesting schedule in the project’s documentation, and list the large unlocks in the next twelve months.
- Compare market cap with FDV and with daily trading volume.
- Look at the top holders on a blockchain explorer.
- Identify the token’s uses and whether fees support it or only new issuance.
- Check who controls changes: governance, a foundation or admin keys.
Limits
Good tokenomics cannot rescue a product nobody uses, and published schedules can be changed by governance. Treat tokenomics as a risk filter alongside the project itself. Tokenomics also says little about short-term price moves, which are driven far more by market sentiment and liquidity. See how to research a crypto asset.
Frequently asked questions
What makes tokenomics “good”?
There is no single formula, but sound designs share traits: most supply already circulating or released slowly, insiders locked for years rather than months, demand tied to real use, and issuance that does not depend on ever-rising prices. Clear, stable documentation is part of it too.
Is a fixed supply always better?
Not always. A fixed supply protects against dilution but cannot pay ongoing rewards to those who secure a network once issuance ends, so fees must take over. Some networks choose modest ongoing issuance to fund security. What matters is whether the design fits the token’s purpose and is credible.
Do token burns always raise the price?
No. A burn reduces supply, which helps only if demand holds steady or grows. A burn funded by real fees is a meaningful transfer of value to holders; a burn of tokens the team already held, or a small burn alongside large ongoing issuance, may change little. Compare the amount burned with new issuance and with unlocks over the same period.
Where can I find a token’s tokenomics?
Start with the project’s own documentation or white paper for allocation and vesting, then compare with independent data sites for circulating and total supply and with unlock trackers for upcoming releases. Where the numbers disagree, the difference itself is worth investigating.
For the on-chain side of evaluating tokens, see what on-chain analysis is.
This article is educational content and does not constitute financial, investment, legal or tax advice. Digital assets are volatile and you may lose the amount you invest.