
How to Use the Commitments of Traders Report
The CFTC's COT report shows weekly how hedgers and speculators are positioned in US futures. How to read net positions, spot extremes and avoid timing traps.
To use the Commitments of Traders (COT) report, get the CFTC’s weekly data for your market, find each trader group’s net position, compare it with past weeks and its historical range, and look for extremes that suggest crowding. It is published Fridays at 3:30 p.m. Eastern time for positions as of Tuesday.
Before you start
Pick the right report: the “disaggregated” report for commodities separates Producer/Merchant (commercial hedgers), Swap Dealers, Managed Money (hedge funds and trend followers), Other Reportables and Non-Reportable positions.
Using it, step by step
Find your market
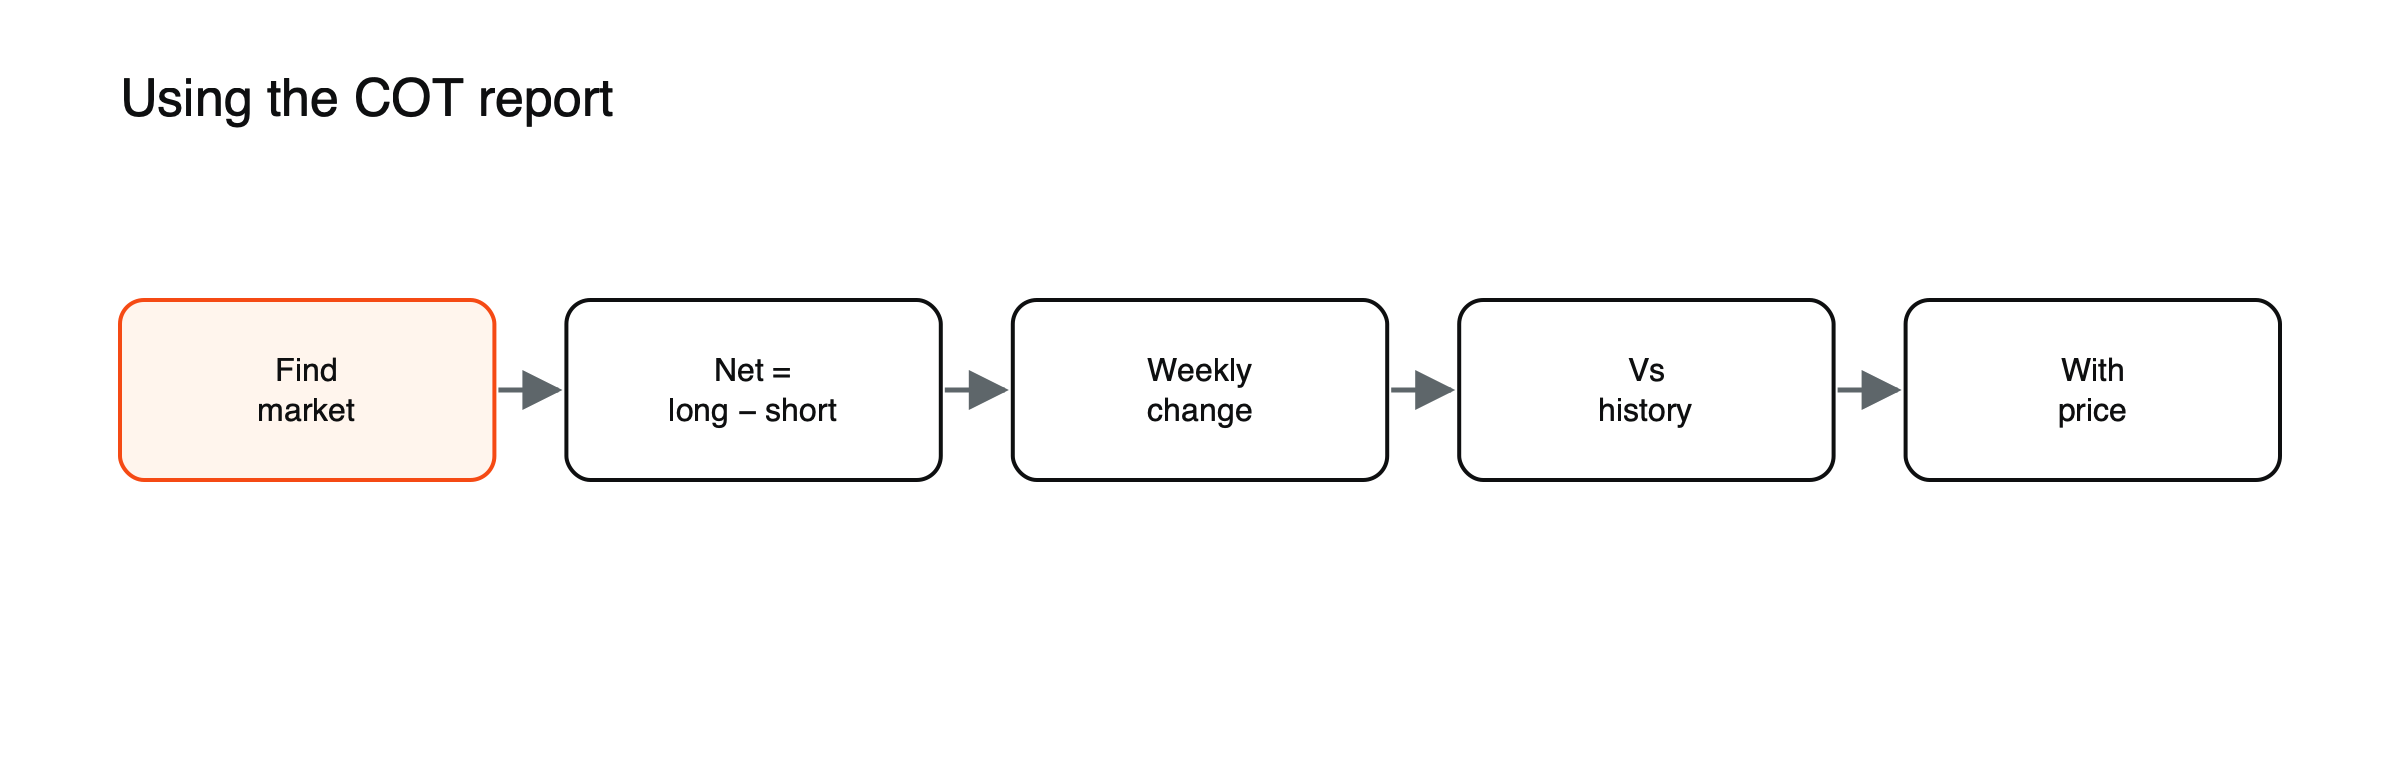
Figure: Using the COT report.
For example, COMEX gold futures or NYMEX crude oil.
Calculate net positions
Net = longs − shorts. If Managed Money holds 180,000 long and 30,000 short gold contracts, it is net long 150,000.
Track the change
Week-over-week changes show whether speculators are adding to or cutting positions.
Compare with history
Net positions near multi-year highs or lows can mean the trade is crowded.
Combine with price
Rising prices with rising Managed Money longs suggest momentum; prices rising while longs fall may signal short covering.
Who is in each group
| Group | Who they are | What their positions usually reflect |
|---|---|---|
| Producer/Merchant | Miners, oil producers, refiners, merchants | Hedging physical business |
| Swap Dealers | Banks dealing in swaps with clients | Offsetting client trades |
| Managed Money | Hedge funds, commodity trading advisers | Speculative views, often trend-following |
| Other Reportables | Other large traders | Mixed motives |
| Non-Reportable | Smaller traders below reporting thresholds | Mixed, often retail |
A week, worked through
Suppose Managed Money in gold futures was net long 150,000 contracts last week and is net long 120,000 this week, while the gold price barely moved. (Illustrative figures.) Speculators cut their net long by 30,000 contracts without pushing prices lower, which suggests other buyers absorbed the selling. If over the past three years the Managed Money net position ranged from 40,000 to 220,000, today’s 120,000 sits a little below the middle, about 44% of the way up the range. That is neither crowded nor washed out, so the report adds context but no strong signal this week.
A simple positioning index
Many traders turn net positions into a 0-to-100 scale: the current net position minus its lowest level over a chosen period, divided by the range between the highest and lowest. A reading near 100 means speculators are as long as they have been over that period; near 0, as short. Extreme readings point to crowded trades that can reverse sharply if prices move against them, though they can stay extreme for a long time.
Common mistakes
- Treating it as a timing signal: the data is three days old when released, and extremes can last for months.
- Ignoring hedgers: commercial positions reflect hedging needs, not forecasts.
See how commodity CFDs work, what moves gold prices and what short interest is.
Which version of the report
The CFTC publishes several versions. The disaggregated report, described above, is used for most commodities. The legacy report uses older, broader categories. Financial futures, including currencies and stock indices, have their own Traders in Financial Futures report, with groups such as asset managers and leveraged funds. Choosing the right version for your market avoids comparing different kinds of traders.
Using the report for currencies
Currency futures on US exchanges also appear in the reports, so traders can see how speculators are positioned in the euro, yen or Australian dollar. Large speculative short positions in a currency, for example, can warn that a carry trade has become crowded, which matters for pairs prone to sharp reversals. See carry trade mistakes that hurt in a risk-off move.
Timing of the data
The report shows positions as of Tuesday and is usually published on Friday afternoon, New York time, so it is several days old on release. Holiday weeks can shift the schedule. It is best used to understand the market’s medium-term positioning rather than to time entries and exits.
Limitations
The report covers futures and some options on US exchanges only, not over-the-counter positions or CFDs. Traders are classified by their main business, which does not always match the purpose of every position. And a crowded position can grow even more crowded before it reverses. Used alongside price, the curve and fundamental news, it is a useful piece of context, not a signal on its own.
Open interest
The report also shows open interest, the total number of contracts outstanding. Rising open interest alongside rising prices suggests new money entering the market; rising prices with falling open interest can mean shorts are covering rather than new buyers arriving. Combining open interest with the change in Managed Money positions gives a fuller picture of who is driving a move. See what open interest is.
Reading the commercials
Producer and merchant positions mostly reflect hedging. When prices rise, producers often sell more futures to lock in good prices for future output, so their net short position grows. That is not a forecast that prices will fall; it is a business decision. Some analysts watch for unusual commercial behavior, such as producers hedging much less than normal, as a hint that they expect higher prices, but the signal is subtle and inconsistent.
A weekly routine
On Friday or over the weekend, note the Managed Money net position for each market you trade, the change from last week and where it sits in its range over the past three years. Mark any market where positioning is near an extreme. On Monday, combine that view with price action and upcoming news. Over time, the record shows which extremes in your markets were followed by reversals and which simply persisted.
A crowded trade, illustrated
Suppose Managed Money in crude oil has built its largest net long position in three years while prices have climbed steadily. (Illustrative scenario.) A modestly bearish inventory report then pushes prices down 2%. Funds that bought late start selling to limit losses, and their selling pushes prices down further, triggering more stops. Within a week, prices have fallen 8% and the COT report shows the net long cut sharply. Nothing in the fundamentals changed that much; the positioning made the market fragile. Seeing that build-up in the weekly reports would not have predicted the day of the fall, but it would have warned that a long position was riding with a very large crowd. Crowds tend to leave through the same narrow door.
Frequently asked questions
Is it a bullish sign when speculators are very long?
Not necessarily. It shows strong conviction, but also that many potential sellers exist if the price turns, so extremes can precede reversals.
Why do commercial hedgers often hold the opposite position to speculators?
Because producers sell futures to lock in prices for their output, and their hedging tends to increase when prices rise, while speculators often follow price trends.
This article is educational content and does not constitute financial, investment, legal or tax advice. Digital assets are volatile and you may lose the amount you invest.