
How Commodity CFDs Work
Commodity CFDs track oil, gold, silver, gas and crops, usually via futures. How they are priced, margin limits, contract rolls and the lessons of oil in 2020.
Commodity CFDs let you trade oil, gold, silver, gas, metals or crops without owning or storing them. Most are priced from futures, which expire, so providers roll or adjust positions at expiry. EU retail rules allow up to 20:1 leverage on gold and 10:1 on other commodities. Prices can move sharply, as oil showed in April 2020.
What counts as a commodity CFD
| Group | Common examples | Typical drivers |
|---|---|---|
| Energy | Crude oil (WTI, Brent), natural gas, heating oil | Supply decisions, inventories, weather, geopolitics |
| Precious metals | Gold, silver, platinum | Real interest rates, the dollar, safe-haven demand |
| Industrial metals | Copper, aluminum, nickel | Global growth, China, supply disruptions |
| Agriculture | Wheat, corn, soybeans, coffee, sugar | Weather, harvests, trade policy |
Providers offer different selections, and contract sizes vary by provider, so the same move can mean very different amounts of money on two platforms.
Who trades commodities, and why
Commodity markets exist first for producers and users: oil companies, miners, farmers, airlines and food manufacturers use futures to lock in prices for what they will sell or buy. Investors use commodities to diversify or to hedge against inflation, and speculators trade price moves. Retail CFD traders sit in the last group, taking views on price without any interest in the physical goods. Understanding that the market is shaped by hedgers with physical needs helps explain moves around delivery dates and inventory reports.
How a commodity CFD is priced
- Futures-based: tracks a specific futures month and rolls at expiry. See how a futures roll adjusts a commodity CFD price.
- Spot or cash: tracks a rolling near-term price with daily financing that reflects the futures curve.
Futures-based and cash CFDs, worked through
Suppose a trader holds a long futures-based oil CFD of 100 barrels as the contract approaches expiry. The expiring month trades at $80 and the next month at $81, a market in contango. (Illustrative prices.) At the roll, the provider moves the position to the next month and adjusts it, typically by debiting about $1 a barrel, around $100, so that the profit or loss so far is unchanged while the position now tracks the higher-priced contract. A cash CFD on the same oil avoids the roll but builds the same carry into daily financing, which over a month on an $8,000 position at an illustrative 6% a year would be about $39, plus any adjustment reflecting the curve. Either way, holding longs in contango costs money over time. See what contango and backwardation are.
How a trade works
Choose a direction and size, for example 100 barrels of oil or 10 ounces of gold, post margin, and close for the price difference. Example: 100 barrels at $80 = $8,000 position; at 10:1, margin is $800. A $2 move is $200.
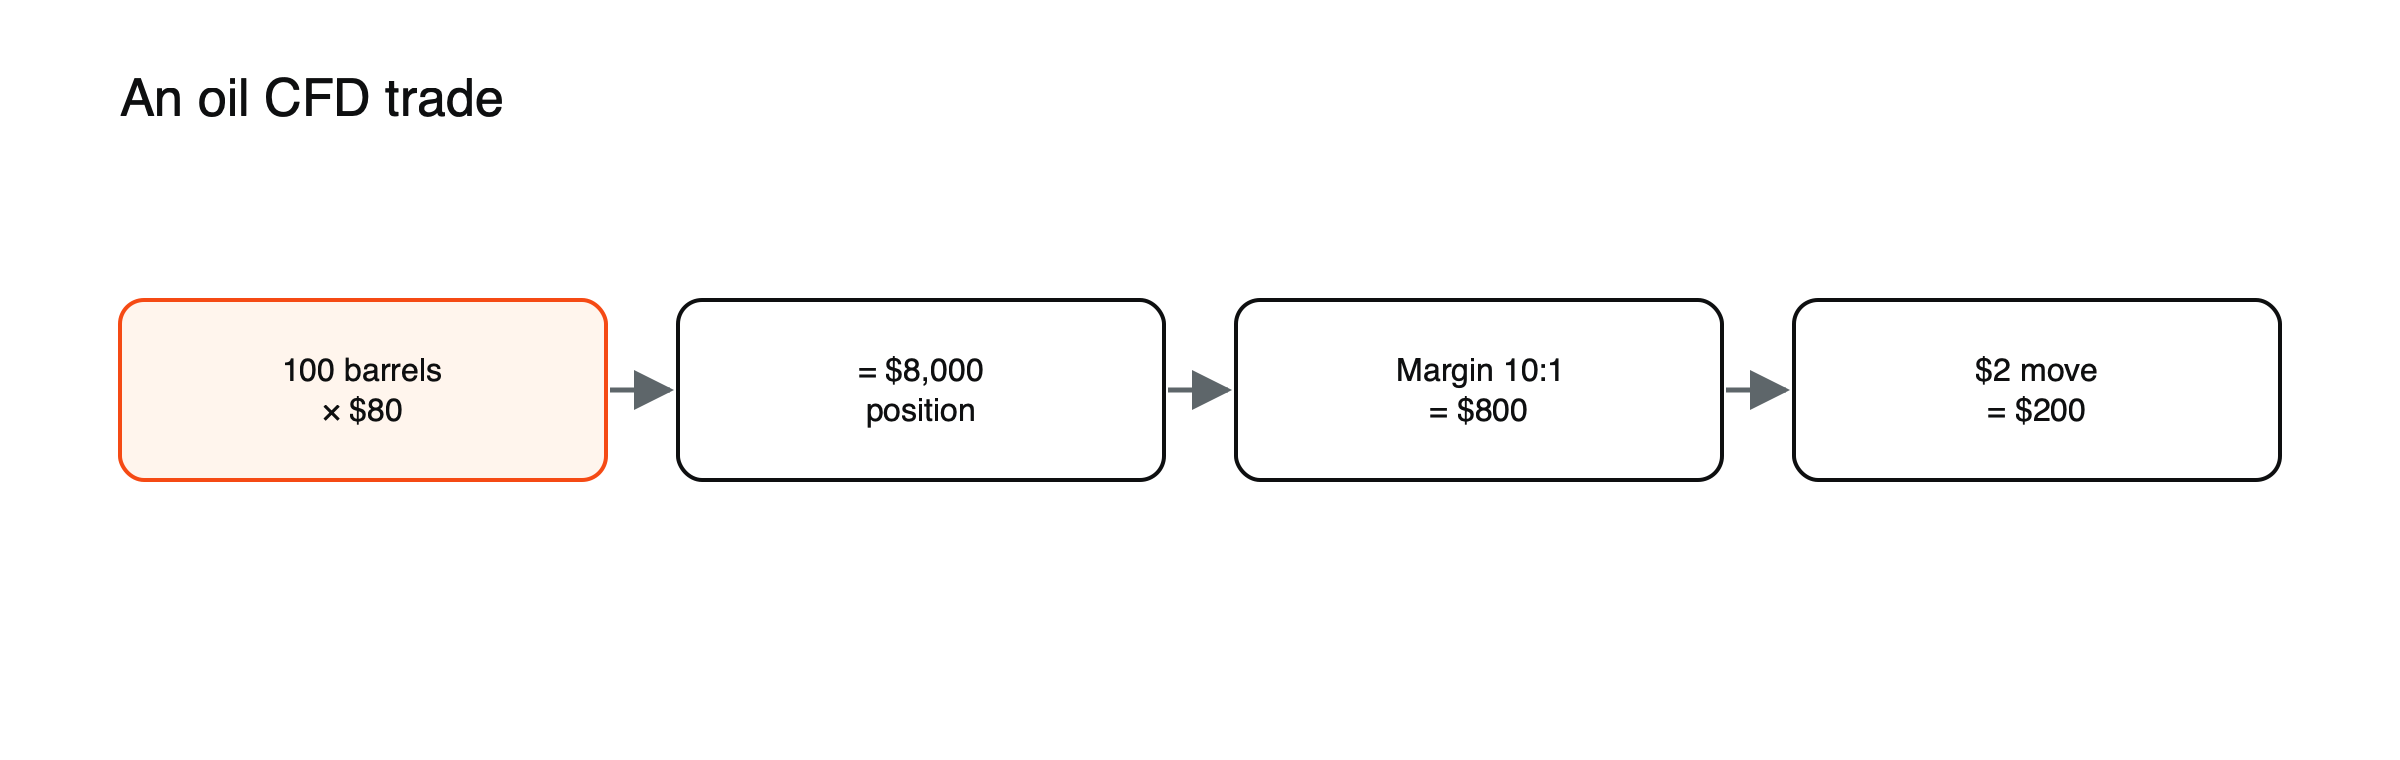
Figure: An oil CFD trade (example values).
A gold trade
A trader buys 10 ounces of gold at $2,400, a $24,000 position. Under EU retail rules, gold carries a 20:1 cap, so margin is about $1,200. A $30 rise gains $300, a quarter of the margin; a $30 fall loses the same. (Illustrative prices.) Gold often moves $30 or more in a day around US inflation data or central bank decisions, so even a modest position can swing noticeably. See what moves gold prices.
What moves commodity prices
Supply and demand, inventories, weather, geopolitics, the US dollar and the futures curve. See what contango and backwardation are.
Drivers by group
Energy prices respond to production decisions by OPEC+ and others, weekly inventory data, refinery outages, weather and conflicts in producing regions. Precious metals respond above all to real interest rates and the dollar, and to buying by central banks. Industrial metals track the outlook for manufacturing and construction, especially in China. Agricultural prices depend heavily on weather, planting and harvest reports and trade policy. Knowing which group a commodity belongs to points to which news matters. See what moves oil prices.
Reports that move commodities
Several scheduled releases move commodity prices. In the United States, weekly oil inventory data from the Energy Information Administration often move crude. Meetings of OPEC+ can shift oil sharply. Monthly crop reports from the US Department of Agriculture move grains. A weekly report on futures positioning shows how speculators and hedgers are placed. Adding these to an economic calendar alongside currency events gives a complete picture. See how to read the EIA oil inventory report and what the Commitments of Traders report shows.
The dollar connection
Most commodities are priced in US dollars, so a stronger dollar makes them more expensive for buyers using other currencies and tends to weigh on prices, while a weaker dollar tends to support them. The link is not constant, but it is strong enough that commodity traders watch the dollar alongside their own markets. See how the US dollar affects commodity prices.
Key risks
- Gaps and spikes on supply shocks and reports.
- Expiry effects: in April 2020, the expiring May WTI contract settled at −$37.63 as storage ran out.
- Leverage on volatile markets.
See spot vs futures prices and what a CFD is.
An oil trade from entry to exit
A trader buys a cash oil CFD of 100 barrels at $80.00, paying a spread of about $0.04 a barrel, roughly $4. Margin at 10:1 is about $800. The position is held for five nights, with financing of about $6.58 at an illustrative 6% a year. Oil rises to $82.50, and the trader closes for a gross gain of $250. After spread and financing, the net result is about $239. Had oil fallen $2.50 instead, the loss would have been about $261 after costs, close to a third of the margin. (Illustrative figures.)
How much commodities move
Commodities differ widely in volatility. Natural gas is often among the most volatile, capable of double-digit percentage moves in days during weather scares. Crude oil regularly moves several percent in a day around supply news. Gold and other precious metals are usually calmer but can jump on surprises in inflation data or geopolitics. Agricultural prices can gap on crop reports. Sizing each position by the commodity’s own typical range, rather than reusing the same size everywhere, keeps risk consistent. See what moves natural gas prices.
Trading hours
Commodity CFDs generally follow the hours of the exchange where the underlying futures trade. Many energy and metals contracts trade almost around the clock on weekdays with a short daily break, while some agricultural contracts have shorter sessions. Outside the busiest hours, spreads widen, and at each daily reopen, prices can jump if news arrived during the break. Knowing the hours for each market avoids placing orders when liquidity is thin.
Other ways to get commodity exposure
CFDs are one route among several. Exchange-traded products track commodity prices or futures indices without leverage. Futures give direct exchange access but in larger contract sizes. Shares in producers, such as gold miners or oil companies, offer indirect exposure, along with company-specific risks. CFDs suit short-term, leveraged views; long-term exposure is often cheaper through unleveraged products. See gold vs gold miners.
Seasonal patterns
Some commodities follow seasonal rhythms. Natural gas demand rises in winter for heating and in summer for cooling, gasoline demand peaks in the summer driving season and agricultural prices often move around planting and harvest. These patterns are tendencies, not rules, and are well known to the market, so they are usually priced in. Unusual weather or supply disruptions that break the pattern tend to produce the larger moves. Seasonal effects are usually best treated as background context for a trade, not simply as a reason to trade on their own, especially when using leverage.
Costs specific to commodities
Commodity CFDs often have wider spreads than major currency pairs, especially outside the main trading hours of the underlying exchange. Futures-based contracts add roll adjustments; cash contracts add financing that reflects the futures curve. Some markets have daily price limits on their exchanges, and many close for part of the day, so gaps at the reopen are common. Checking the contract specification, including trading hours, expiry dates and roll policy, should come before the first trade. See how to read a commodity contract specification.
Commodities in a wider portfolio
Commodities can behave differently from stocks and bonds, which is why some investors hold them for diversification or as a hedge against inflation. The relationship is uneven: commodities have protected well in some inflationary periods and poorly in others, and they can fall sharply with stocks in a recession. Leveraged CFD positions are better suited to shorter-term views than to long-term hedging. See whether commodities are an inflation hedge.
Lessons from history
Commodity markets have produced some of the most dramatic episodes in financial history: the 1973 oil embargo, the 2014–2016 oil price collapse, the negative oil prices of April 2020 and the 2022 nickel squeeze on the London Metal Exchange, when trading was suspended and trades were cancelled. Each shows how supply shocks, storage limits and crowded positions can produce moves far beyond normal ranges. See the 1973 oil crisis, negative oil prices in 2020 and the 2022 LME nickel squeeze.
A checklist before a commodity trade
- Is the CFD futures-based or cash, and when is the next roll or expiry?
- What is the contract size, and what is one point worth in money?
- Which scheduled reports or meetings are due before you plan to close?
- What is the current spread compared with its usual level?
- Is the position sized for the commodity’s typical daily range?
Frequently asked questions
Do I ever have to take delivery of the commodity?
No. CFDs are cash-settled contracts; you only receive or pay the price difference. Providers roll or close futures-based positions before delivery.
Why is leverage lower on commodities than on currencies?
Because most commodities are more volatile than major currency pairs. EU retail rules cap gold at 20:1 and other commodities at 10:1, compared with 30:1 for major currency pairs.
Which commodity is best for beginners?
Many start with gold or crude oil because of their liquidity and the wealth of information about them, but both can move sharply. Small positions and clear rules matter more than the choice of commodity.
Leverage, margin and cost figures in this article are example values for illustration. Actual terms depend on the provider, the instrument and the rules in your country.
This article is educational content and does not constitute financial, investment, legal or tax advice. Digital assets are volatile and you may lose the amount you invest.
Sources
- ESMA adopts CFD measures (gold 20:1; commodities other than gold 10:1) — Finadium
- CFTC staff interim report on NYMEX WTI trading around April 20, 2020 (May contract fell from $17.73 to settle at −$37.63; first negative price in 37 years) — CFTC
- Fees and charges (futures-based CFDs roll at expiry; adjustments) — Axi