
How Much Does an ETF’s Expense Ratio Cost You Over 10 Years?
On $10,000 growing 7% a year, a 0.03% fee leaves about $19,616 after 10 years vs $17,908 at 1%. How ETF expense ratios compound and how to compare them.
An ETF’s expense ratio is the annual fee taken from its assets, and it compounds. On $10,000 growing 7% a year before fees, a 0.03% fee leaves about $19,616 after 10 years, 0.50% about $18,771 and 1% about $17,908, a gap of about $1,700, or 17% of the original investment.
The formula
Ending value = starting amount × (1 + return − fee)^years (a simplified approximation)
Worked example: $10,000, 7% a year, 10 years
| Expense ratio | Ending value | Cost vs no fee ($19,672) |
|---|---|---|
| 0.03% | $19,616 | $56 |
| 0.0945% | $19,498 | $174 |
| 0.50% | $18,771 | $901 |
| 1.00% | $17,908 | $1,764 |
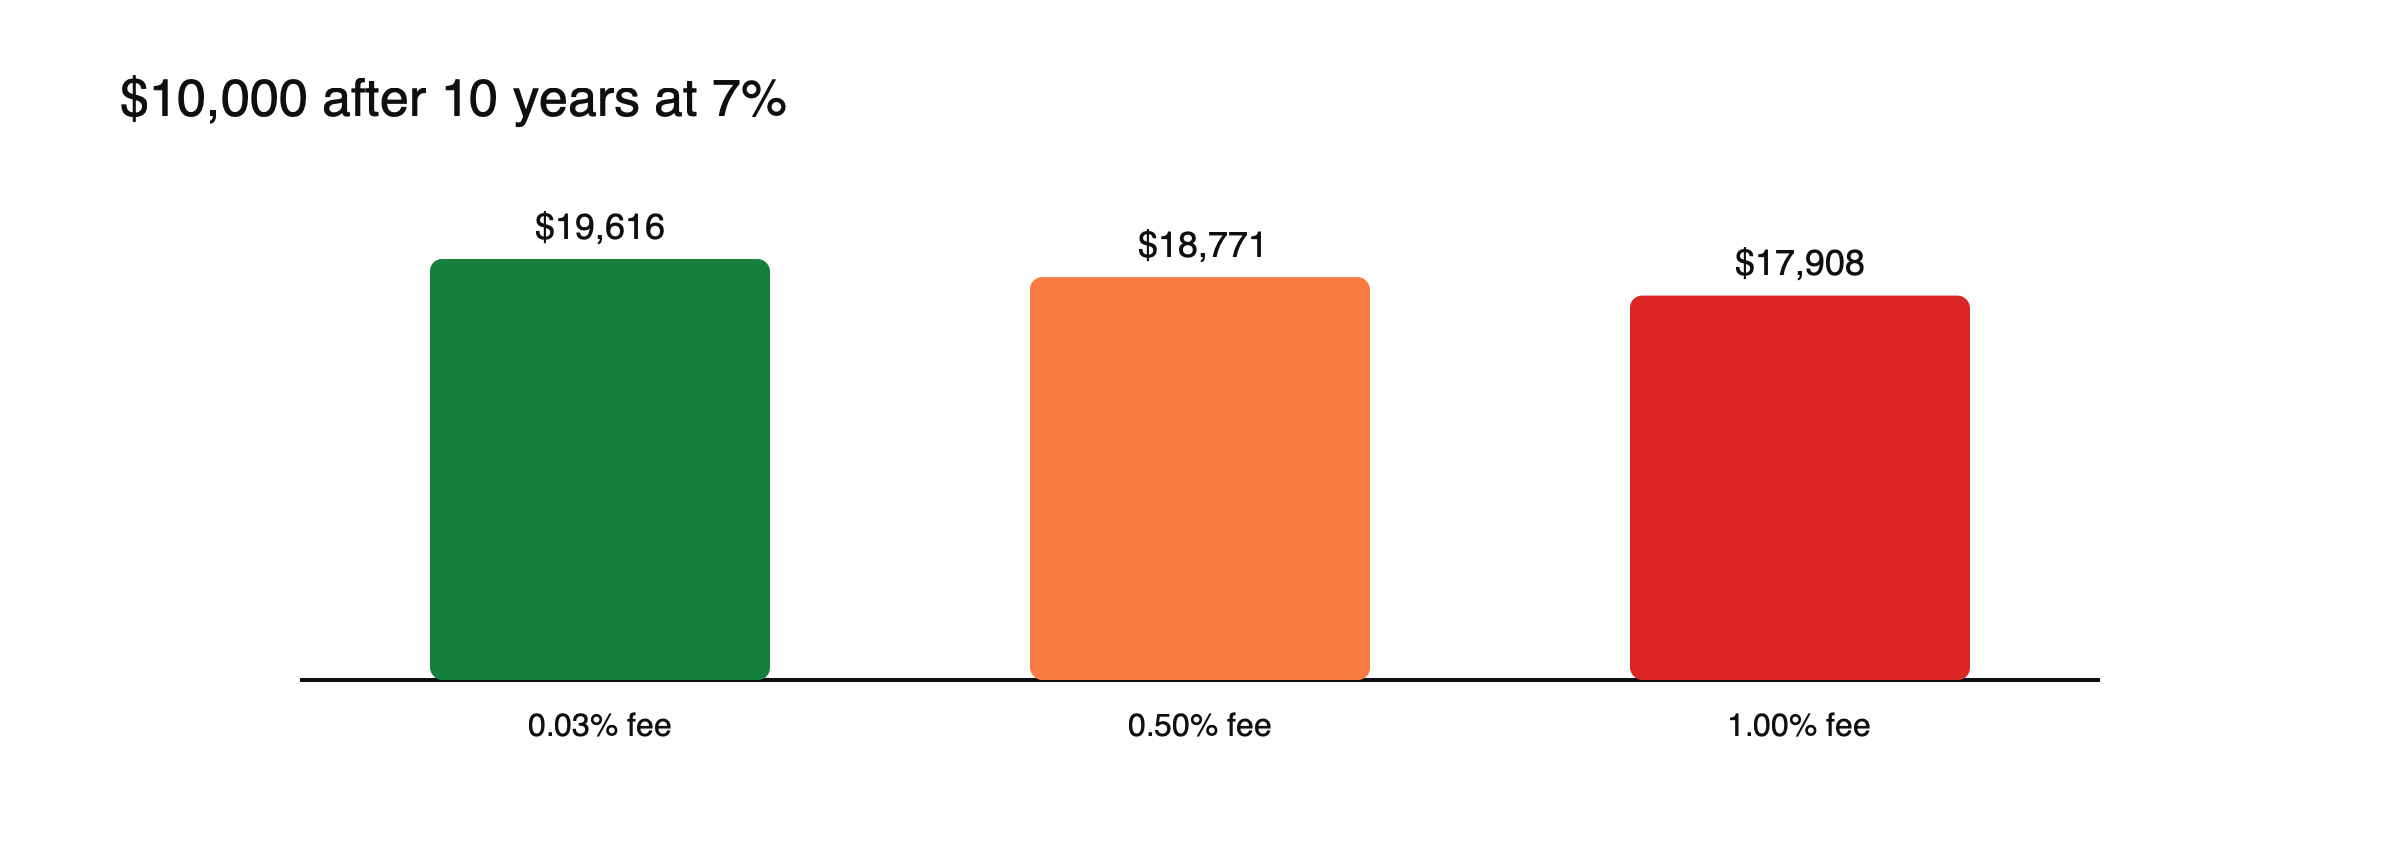
Figure: Fees compound (example values).
(Example values; returns are not guaranteed.)
Over 20 and 30 years
| Expense ratio | After 20 years | After 30 years |
|---|---|---|
| None | $38,697 | $76,123 |
| 0.03% | $38,480 | $75,485 |
| 0.0945% | $38,019 | $74,131 |
| 0.50% | $35,236 | $66,144 |
| 1.00% | $32,071 | $57,435 |
(Starting with $10,000 at 7% a year before fees; example values.) Over 30 years, a 1% fee costs nearly $19,000 compared with no fee, almost twice the original investment, while a 0.03% fee costs about $640. Time multiplies the effect of small differences.
How the fee is taken
The expense ratio is not billed separately. The fund deducts it gradually from its assets, usually daily, so it shows up as a slightly lower net asset value and a slightly lower return than the index. Investors never see a separate charge, which is why the fee is easy to overlook.
Why small differences matter
The largest S&P 500 ETFs charge 0.03%, while SPY charges 0.0945%; investors moved heavily toward the cheaper funds, making Vanguard’s VOO the largest ETF in 2025. Thematic funds often charge 0.6% or more.
Fees on different kinds of ETF
Broad index ETFs on large markets are usually the cheapest. Funds tracking narrower markets, bonds of particular types, emerging markets or specific strategies tend to charge more, and thematic and active funds more still. A higher fee is not automatically bad, but it needs to be justified by exposure you cannot get more cheaply.
What the expense ratio leaves out
Trading spreads, commissions and tracking differences also affect returns. See what tracking difference is in an ETF.
ETF CFDs
On a CFD, the ETF’s fee is already in its price, but daily financing is usually a much larger cost for long holds. See ETF CFDs vs buying ETF shares and what an ETF is.
Other costs, illustrated
Suppose an investor buys $10,000 of a small, specialized ETF with a 0.20% bid-ask spread, paying about $10 on entry and $10 on exit, and $5 in commissions each way. (Example values.) For a long-term holding, these are small next to years of fees; for frequent trading, they can exceed the annual expense ratio many times over. Large, liquid ETFs with very tight spreads keep these costs low.
Where to find the fee
The expense ratio, sometimes called the ongoing charge, appears on the fund’s factsheet, key information document and website. Comparing funds on the same index by fee and by tracking difference together gives the clearest picture of total cost. See how to read an ETF factsheet.
Fees compared with CFD financing, illustrated
Holding $10,000 of an S&P 500 ETF at a 0.03% expense ratio costs about $3 a year. Holding the same exposure through a CFD on the ETF, with financing at an illustrative 7% a year, costs about $700 a year, more than 200 times as much, before spreads. (Example values.) For long-term holding, owning ETF shares is far cheaper; CFDs make sense for short-term trades, short positions or hedges, where the holding period is measured in days. See ETF CFDs vs buying ETF shares.
Competition on fees
Fees on the largest index ETFs have fallen sharply over the past two decades as providers competed for assets. The shift is visible in the largest S&P 500 funds: the fund charging 0.03% overtook the older fund charging 0.0945% to become the world’s largest ETF in 2025. Investors have shown that, for funds tracking the same index, small fee differences decide where money goes.
Does a higher fee buy better performance?
For index funds tracking the same index, a higher fee almost always means lower returns, because the underlying holdings are the same. For active or thematic funds, a higher fee pays for management or specialized exposure, but research on thematic funds has found that only a minority outperform over long periods. The fee is a certain cost; any extra return is not.
Common misreadings
- Dismissing fee differences of a few hundredths of a percent.
- Assuming the expense ratio is the only cost.
A fee checklist
- What is the expense ratio, and how does it compare with similar funds?
- What are typical spreads when buying and selling?
- How large is the tracking difference over several years?
- How long do you plan to hold?
Terms used in Europe
In Europe, the fee is often shown as the ongoing charges figure, or OCF, or the total expense ratio, or TER, in the fund’s key information document. These include management and operating costs but not transaction costs inside the fund, which are reported separately. Comparing funds on the same basis avoids mixing figures that include different costs.
Fees per $1,000 invested
Expressing fees in money makes them concrete. A 0.03% fee costs $0.30 a year for every $1,000; a 0.50% fee costs $5; a 1% fee costs $10. For an investor with $50,000, those become $15, $250 and $500 a year, before compounding.
When paying more can make sense
A higher fee can be justified when a fund provides exposure that cannot be obtained cheaply elsewhere, such as a specialized market, a currency-hedged version of an index or a strategy the investor deliberately wants. The question to ask is whether the extra cost buys something specific and valuable, not simply whether the fund has performed well recently.
Watching for fee changes
Providers sometimes cut fees to compete, and occasionally raise them or close small funds. Checking a fund’s fee once a year, along with its size and tracking difference, keeps holdings competitive. Moving between funds has costs of its own, including spreads and possible taxes, so switching makes sense only when the long-term saving clearly exceeds them. A switch that saves 0.20% a year on $50,000 is worth $100, which can outweigh one-off costs, while a saving of 0.01% rarely justifies the effort or the tax.
Frequently asked questions
Is the cheapest ETF always best?
Not always. Tracking difference, liquidity, size and structure also matter, but among funds tracking the same index, low cost is a strong advantage.
Do I pay the expense ratio if I hold an ETF for only a few days?
Yes, but only for the days you hold it, because the fee is deducted from the fund’s assets daily.
Leverage, margin and cost figures in this article are example values for illustration. Actual terms depend on the provider, the instrument and the rules in your country.
This article is educational content and does not constitute financial, investment, legal or tax advice. Digital assets are volatile and you may lose the amount you invest.