
Correlation Mistakes That Quietly Double Your Forex Risk
One six-position account audited for correlation mistakes: stacked dollar bets, fake hedges, hidden yen in crosses, stale links and crisis risk.
Forex correlation mistakes happen when positions look different but are really the same bet: stacking dollar pairs in one direction, hedging with pairs that move the same way, overlooking the shared currency in crosses, trusting old correlations and forgetting how crises change them. Auditing one sample account shows how quietly the risk adds up.
The account under review
A trader with a $20,000 account holds six positions, each opened for what seemed a separate reason. (Illustrative account and prices.)
| Position | Size | Reason given |
|---|---|---|
| Long EUR/USD at 1.1000 | 1 lot | ECB expected to stay firm |
| Long GBP/USD at 1.2700 | 1 lot | UK wages strong |
| Long AUD/USD at 0.6600 | 0.5 lot | Iron ore rising |
| Short USD/CHF at 0.8800 | 0.5 lot | “Hedge” for the other trades |
| Long EUR/JPY at 165.00 | 0.5 lot | Euro strength, weak yen |
| Short USD/CAD at 1.3600 | 0.5 lot | Oil rising |
Six ideas, six pairs. The audit below takes them apart one currency at a time.
Finding 1: five positions, one dollar bet
Breaking each pair into its two currencies shows that five of the six positions are short the US dollar: about $110,000 through EUR/USD, $127,000 through GBP/USD, $33,000 through AUD/USD and $50,000 each through USD/CHF and USD/CAD. The account is short roughly $370,000 of dollars, about 18 times its equity. A broad 2% rise in the dollar against these currencies would cost about $7,400, more than a third of the account, regardless of how sound each individual idea was. The mistake is stacking dollar trades; the fix is to add up exposure by currency, not by pair.
Finding 2: the hedge that is not a hedge
The short USD/CHF position was meant to offset risk. But being short USD/CHF means being short dollars and long Swiss francs, which adds to the dollar bet rather than balancing it. EUR/USD and USD/CHF usually move in opposite directions on a chart, which is why the position looked like a hedge, but holding long EUR/USD and short USD/CHF together means both positions profit and lose on the same dollar moves. The mistake is hedging with a pair whose relationship has been misread. The fix is to write out the currencies being bought and sold before calling any position a hedge. See how currency correlations work.
Finding 3: the yen hiding in a cross
The long EUR/JPY position is long euros and short yen. Combined with the long EUR/USD, the account is long about 150,000 euros, and the yen short adds a second, separate risk: in a risk-off move, the yen tends to rise sharply. The cross looked like a variation on the euro idea; in fact it added a new exposure that behaves badly in exactly the conditions that would also hurt the AUD/USD position. The mistake is ignoring crosses; the fix is to split every cross into its two currencies. See how cross rates are calculated.
Finding 4: a correlation taken on trust
The short USD/CAD position relies on rising oil supporting the Canadian dollar. That link has been strong at times and absent at others: the correlation between oil and the Canadian dollar fell from about 0.76 to around −0.1 within months in 2010 and 2011. If interest rates or trade news are currently driving the Canadian dollar, the oil idea may have little to do with the result. The mistake is trusting old numbers; the fix is to check the recent relationship before relying on it. See why USD/CAD moves with oil prices.
Finding 5: the crisis test
Finally, the audit asks what happens on a sharp risk-off day. Suppose the dollar rises 2% against the euro, pound, Swiss franc and Canadian dollar, the Australian dollar falls 4% and the yen rises 3% against the euro. Most positions lose together: the dollar shorts, the Australian dollar long and the euro-yen long all move against the account at once. Correlations that looked moderate in calm markets jump toward one. The mistake is forgetting crises; the fix is to size the total exposure for a crisis day, not an average one. See why correlations go to one in a crisis.
The account, rebuilt
A revised version keeps the strongest two or three ideas and sizes them as one combined bet on the dollar, with total risk close to what the trader would accept on a single trade. If a genuine hedge is wanted, it is chosen by currency, for example a small position that gains if the yen rises, rather than by the look of a chart. Every cross is listed by its two currencies, and correlations are rechecked monthly.
The audit in one table
| Finding | Mistake | Fix |
|---|---|---|
| Short dollars in five positions | Stacking same-currency trades | Add up exposure by currency |
| USD/CHF short as a “hedge” | Hedging with a pair that moves the same way | Write out the currencies before hedging |
| EUR/JPY adds a yen short | Ignoring crosses | Split crosses into two currencies |
| Oil and CAD assumed linked | Trusting old correlations | Recheck recent relationships |
| Everything loses on a risk-off day | Forgetting crises | Size for the crisis case |
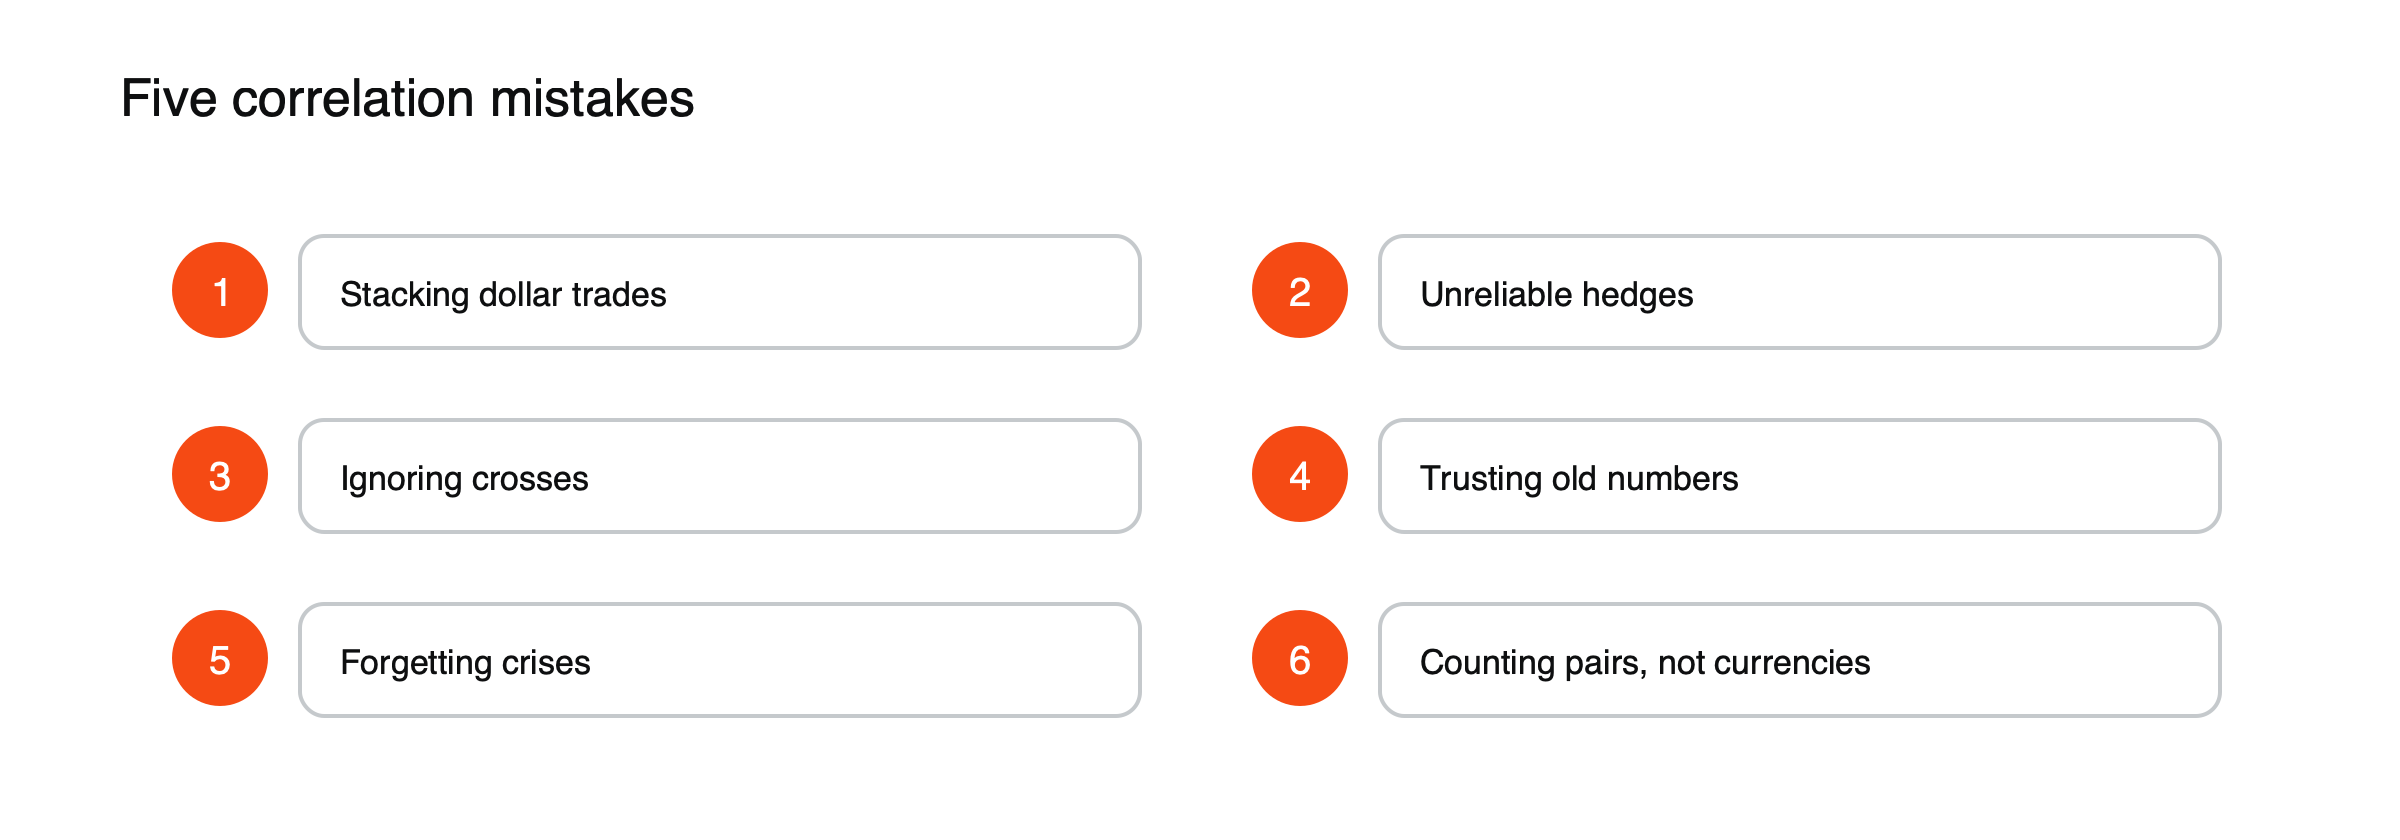
Figure: Five ways correlation doubles risk.
Auditing your own account
Once a week, list every open position by the currencies bought and sold, total the exposure to each currency in your account currency and compare the largest exposure with your equity. Then imagine a 2% move in that currency and a sharp risk-off day, and note the losses. If either number is larger than you would accept on a single trade, the account is carrying more correlated risk than its number of positions suggests. See how to calculate forex position size and what moves currency prices.
The exposure table, worked through
Converting every leg into dollars gives the clearest picture of the sample account. (Approximate figures at the illustrative prices above.)
| Currency | Net exposure | As a multiple of $20,000 equity |
|---|---|---|
| US dollar | About −$370,000 | About 18.5 times, short |
| Euro | About +$165,000 | About 8 times, long |
| British pound | About +$127,000 | About 6 times, long |
| Japanese yen | About −$55,000 | About 3 times, short |
| Swiss franc, Canadian and Australian dollars | About +$50,000, +$50,000, +$33,000 | About 2.5, 2.5 and 1.7 times, long |
Seen this way, the account is not six trades but one very large bet against the dollar, a smaller bet against the yen and a collection of long positions in currencies that all tend to rise or fall together with global risk appetite.
Tools that help
Many trading platforms can show exposure by currency rather than by position, and spreadsheet templates can do the same from a list of open trades. Correlation tables published by brokers and data providers show recent relationships between pairs over different periods. Using both, exposure by currency and up-to-date correlations, catches most of the problems found in this audit before they become losses.
Beyond currency pairs
The same audit applies to whole accounts that hold stock index CFDs, commodities or crypto alongside currencies. A long stock index position, a long Australian dollar position and a long position in a high-yielding currency all tend to lose together when risk appetite collapses, while gold and the yen often move the other way. Adding every position to one exposure view, grouped by how it reacts to a risk-off day, shows whether the account is diversified or simply larger than it looks. See risk-on vs risk-off.
How often to rerun the audit
Exposures change every time a position is opened, closed or resized, and correlations shift with economic news. A quick audit at the start of each week, and again before adding any position in a currency already held, keeps the picture current. A full review, including a crisis test, is worth doing monthly and after any period of unusual market stress, when relationships between currencies are most likely to have changed. Keeping a dated record of each audit also shows how exposure has drifted over time, which is often where hidden risk builds up quietly.
This article is educational content and does not constitute financial, investment, legal or tax advice. Digital assets are volatile and you may lose the amount you invest.