
How to Calculate Free Cash Flow
Free cash flow = operating cash flow − capital expenditures. A worked example gives $100 million, or $2 a share, and why investors trust cash over earnings.
Free cash flow is the cash a business generates after paying for investment: free cash flow = operating cash flow − capital expenditures. A company bringing in $160 million from operations and spending $60 million on capital projects has $100 million, or $2 per share on 50 million shares, for dividends, buybacks or debt repayment.
The formula
FCF = cash from operating activities − capital expenditures
Where to find the numbers
Both figures appear on the cash flow statement. See how to read a cash flow statement.
Worked example (ExampleCo)
- Operating cash flow: $160 million
- Capital expenditures: $60 million
- FCF = $100 million; per share = $2.00
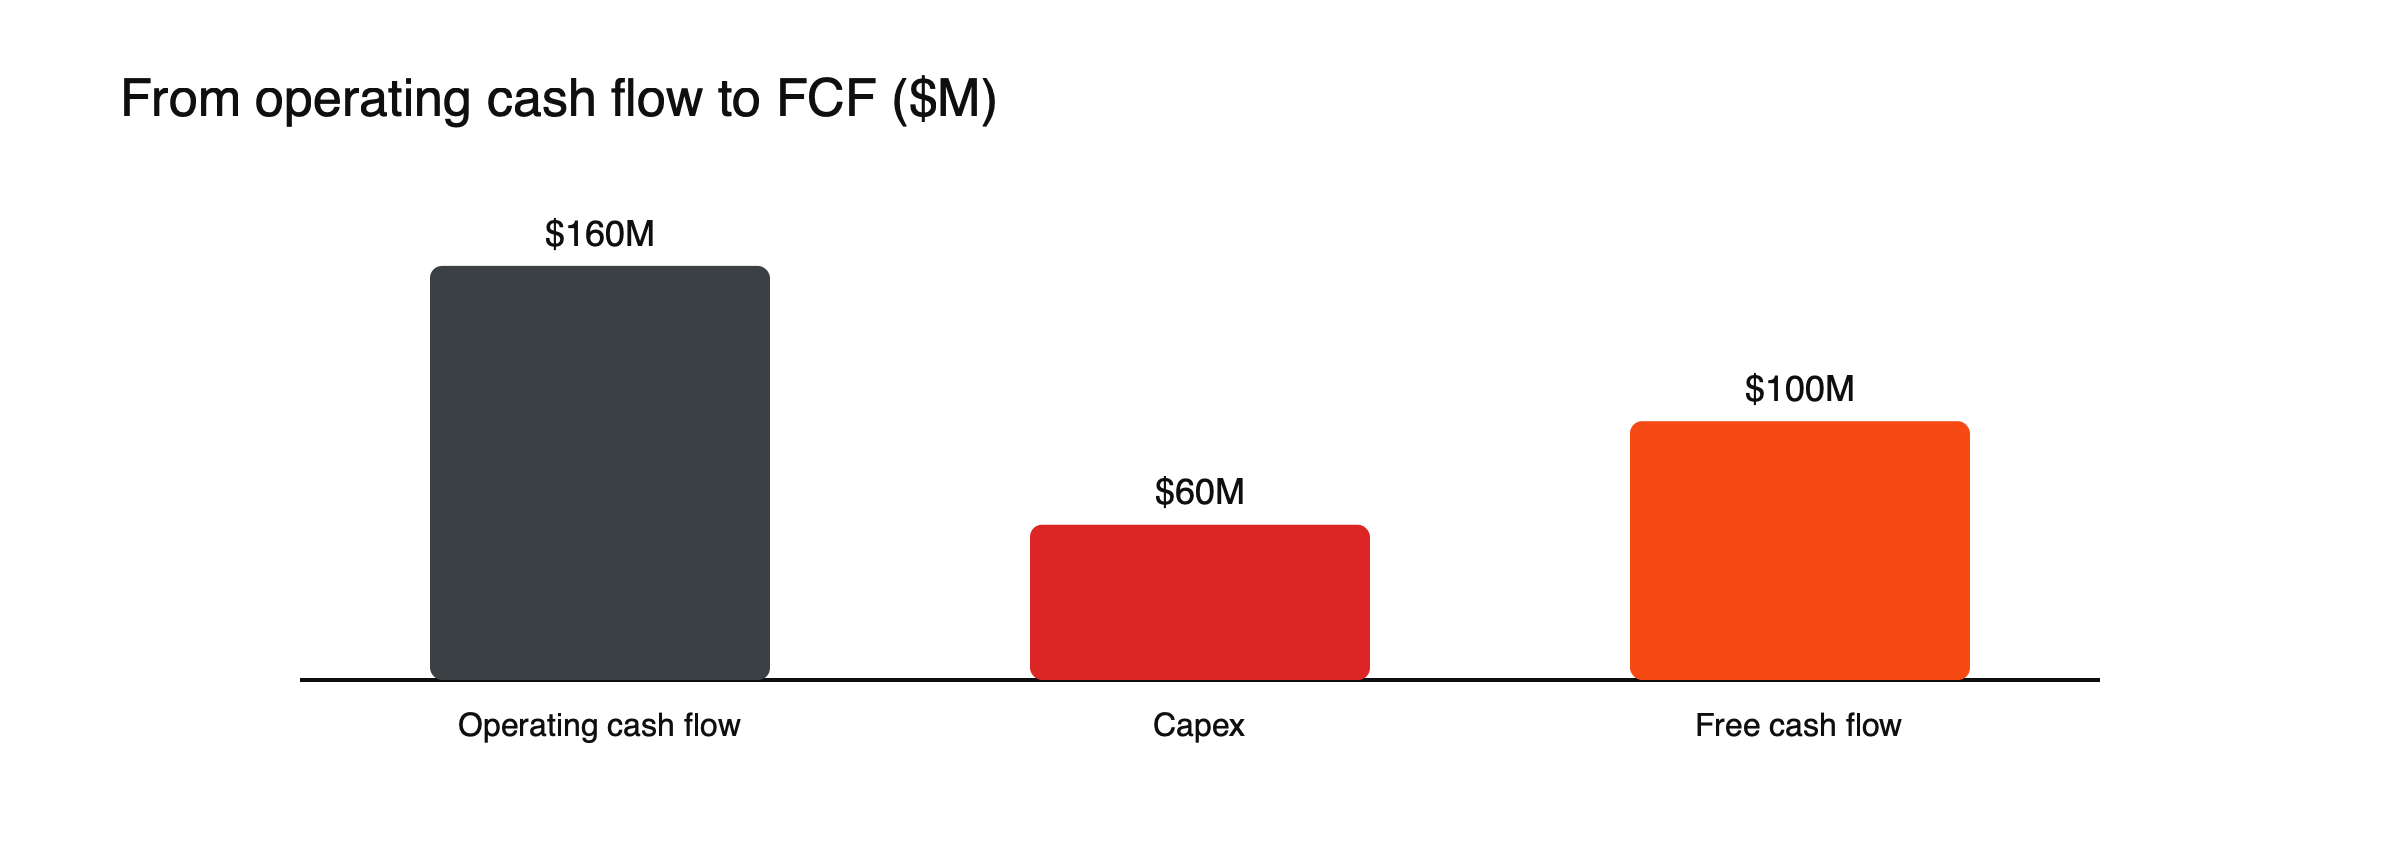
Figure: Free cash flow (hypothetical example, $ million).
FCF margin and conversion
Free cash flow can also be compared with revenue and profit. ExampleCo’s FCF of $100 million on revenue of $1,000 million is an FCF margin of 10%: each dollar of sales leaves ten cents of spare cash. Against net income of $97.5 million, FCF conversion is about 103%, meaning profits are fully backed by cash. Companies that consistently convert less than 70% or 80% of profit into free cash deserve a closer look. (Hypothetical figures.)
Free cash flow yield
FCF per share ÷ share price. At $39: 2 ÷ 39 ≈ 5.1%, comparable with bond yields or a dividend yield.
Comparing yields
ExampleCo’s FCF yield of about 5.1% sits above its dividend yield of 3.0% and a 10-year government bond yield of, say, 4.3%. The gap between FCF yield and dividend yield shows room to maintain or raise the dividend, fund buybacks or repay debt. The price-to-FCF ratio, the inverse of the yield, is 19.5: the market values the company at about 19.5 years of current free cash flow.
Why investors watch it
- Harder to manipulate than net income, which includes non-cash items.
- Earnings quality: if net income keeps exceeding operating cash flow, profits may be overstated or tied up in working capital.
- Funds shareholder returns: dividends and buybacks ultimately come from free cash flow. See how to calculate dividend yield.
Maintenance and growth spending
Not all capital spending is the same. Maintenance capex keeps existing operations running; growth capex expands them. If ExampleCo’s $60 million of capex includes $10 million for new capacity, the cash the business could generate without growing would be about $110 million. Companies rarely split the two precisely, but management commentary and comparisons with depreciation give clues. Investors sometimes call the figure after maintenance spending only “owner earnings.” (Hypothetical figures.)
Levered and unlevered free cash flow
The usual calculation, operating cash flow minus capex, comes after interest payments and is sometimes called levered free cash flow: the cash available to shareholders. Analysts valuing a whole business, including its debt, often use unlevered free cash flow, which adds back after-tax interest. The distinction matters when comparing companies with very different debt levels, in the same way that EV/EBITDA differs from P/E. See what EV/EBITDA is.
Stock-based pay
Many companies pay employees partly in shares. That cost reduces profit but uses no cash, so it is added back in operating cash flow, flattering free cash flow. The cost is still real: it shows up as dilution, a rising share count. For companies with heavy share-based pay, subtracting it from free cash flow, or watching the share count, gives a more honest picture.
Limits
FCF can swing with timing of payments and big investment years. A growing company may have low FCF because it invests heavily, which can be a good sign.
See what EV/EBITDA is and what moves stock prices.
FCF in a valuation
Some investors value companies by forecasting free cash flow for many years and discounting it back to today, a discounted cash flow model. The result depends heavily on assumptions about growth and the discount rate, so small changes produce very different values. Even without a full model, the FCF yield gives a quick check: a company yielding 2% must grow its cash flow quickly to justify its price, while one yielding 8% may be cheap or may face falling cash flows.
How traders use it
Free cash flow figures in results releases can move shares, especially when they differ from profits. A company beating earnings forecasts while reporting weak cash flow may see its shares fall; one with strong cash flow in a weak quarter may hold up. Free cash flow guidance is closely watched for capital-heavy businesses.
Common misreadings
- Treating one year’s negative FCF as a sign of trouble without checking investment plans.
- Ignoring share-based pay.
- Comparing FCF yields of fast-growing and mature companies directly.
Several years, illustrated
| Year | Operating cash flow | Capex | Free cash flow |
|---|---|---|---|
| Year 1 | 140 | 50 | 90 |
| Year 2 | 120 | 85 | 35 |
| Year 3 | 160 | 60 | 100 |
($ million, hypothetical.) Year 2’s weak free cash flow came from a heavy investment year and a dip in operating cash flow, not from a collapse in the business. Looking at three years together shows a company averaging about $75 million of free cash flow, with Year 3 the strongest. A single year can mislead in either direction.
Working capital swings
Changes in receivables, inventory and payables can move operating cash flow, and therefore free cash flow, sharply from one year to the next. A company that builds inventory ahead of a product launch will show weaker cash flow that year; one that collects old receivables will show stronger cash flow. Distinguishing these timing effects from lasting changes in the business is part of reading free cash flow well.
FCF per share over time
Growth in free cash flow per share combines growth in the business with changes in the share count. Steady growth in FCF per share, supported by rising operating cash flow rather than cuts to investment, is one of the strongest signs of a healthy, shareholder-friendly company.
A free cash flow checklist
- Is free cash flow positive over several years?
- How does it compare with net income?
- How much share-based pay is added back?
- Does it cover dividends and buybacks?
Capital-heavy and capital-light businesses
Businesses that need heavy, continuous investment, such as airlines, telecoms or miners, often convert a small share of their profits into free cash flow, because much of their operating cash goes straight back into equipment. Capital-light businesses, such as software or consulting firms, can convert most of their profits. Comparing free cash flow with net income is most useful within the same kind of business.
How companies use free cash flow
Free cash flow can fund dividends, buybacks, debt repayment, acquisitions or a build-up of cash. How a company chooses between them says much about its priorities and its management’s confidence, and changes in that mix are often announced alongside results.
Free cash flow and debt
For indebted companies, free cash flow is what reduces borrowing. A company with $400 million of debt and $100 million of annual free cash flow could, in principle, repay its debt in about four years if it paid no dividends or buybacks. Lenders and rating agencies watch this capacity closely. (Hypothetical figures.) In practice, companies balance debt reduction with shareholder returns, and the mix often shifts noticeably when interest rates rise or fall.
Frequently asked questions
Is free cash flow the same as profit?
No. Profit includes non-cash items and excludes capital spending; free cash flow is the cash left after operating costs and investment.
Can free cash flow be manipulated?
Less easily than profit, but timing can be managed, for example by delaying payments to suppliers or cutting investment temporarily. Looking at several years helps.
Company figures in this article are a hypothetical example (“ExampleCo”) for illustration.
This article is educational content and does not constitute financial, investment, legal or tax advice. Digital assets are volatile and you may lose the amount you invest.