
How to Calculate and Use the Gold-Silver Ratio
Gold-silver ratio = gold price ÷ silver price: about 68.8 in June 2026 after swinging above 100 and below 60. How to calculate it, use it and its limits.
The gold-silver ratio is how many ounces of silver buy one ounce of gold: ratio = gold price ÷ silver price. With gold at $4,063.17 and silver at $59.04 on June 26, 2026, it was about 68.8. A high ratio means silver is cheap relative to gold. It swung from above 100 in 2025 to below 60.
The formula
Gold-silver ratio = gold price per ounce ÷ silver price per ounce
Worked examples
- February 27, 2026: $5,246.70 ÷ $92.02 = 57.0
- June 26, 2026: $4,063.17 ÷ $59.04 = 68.8
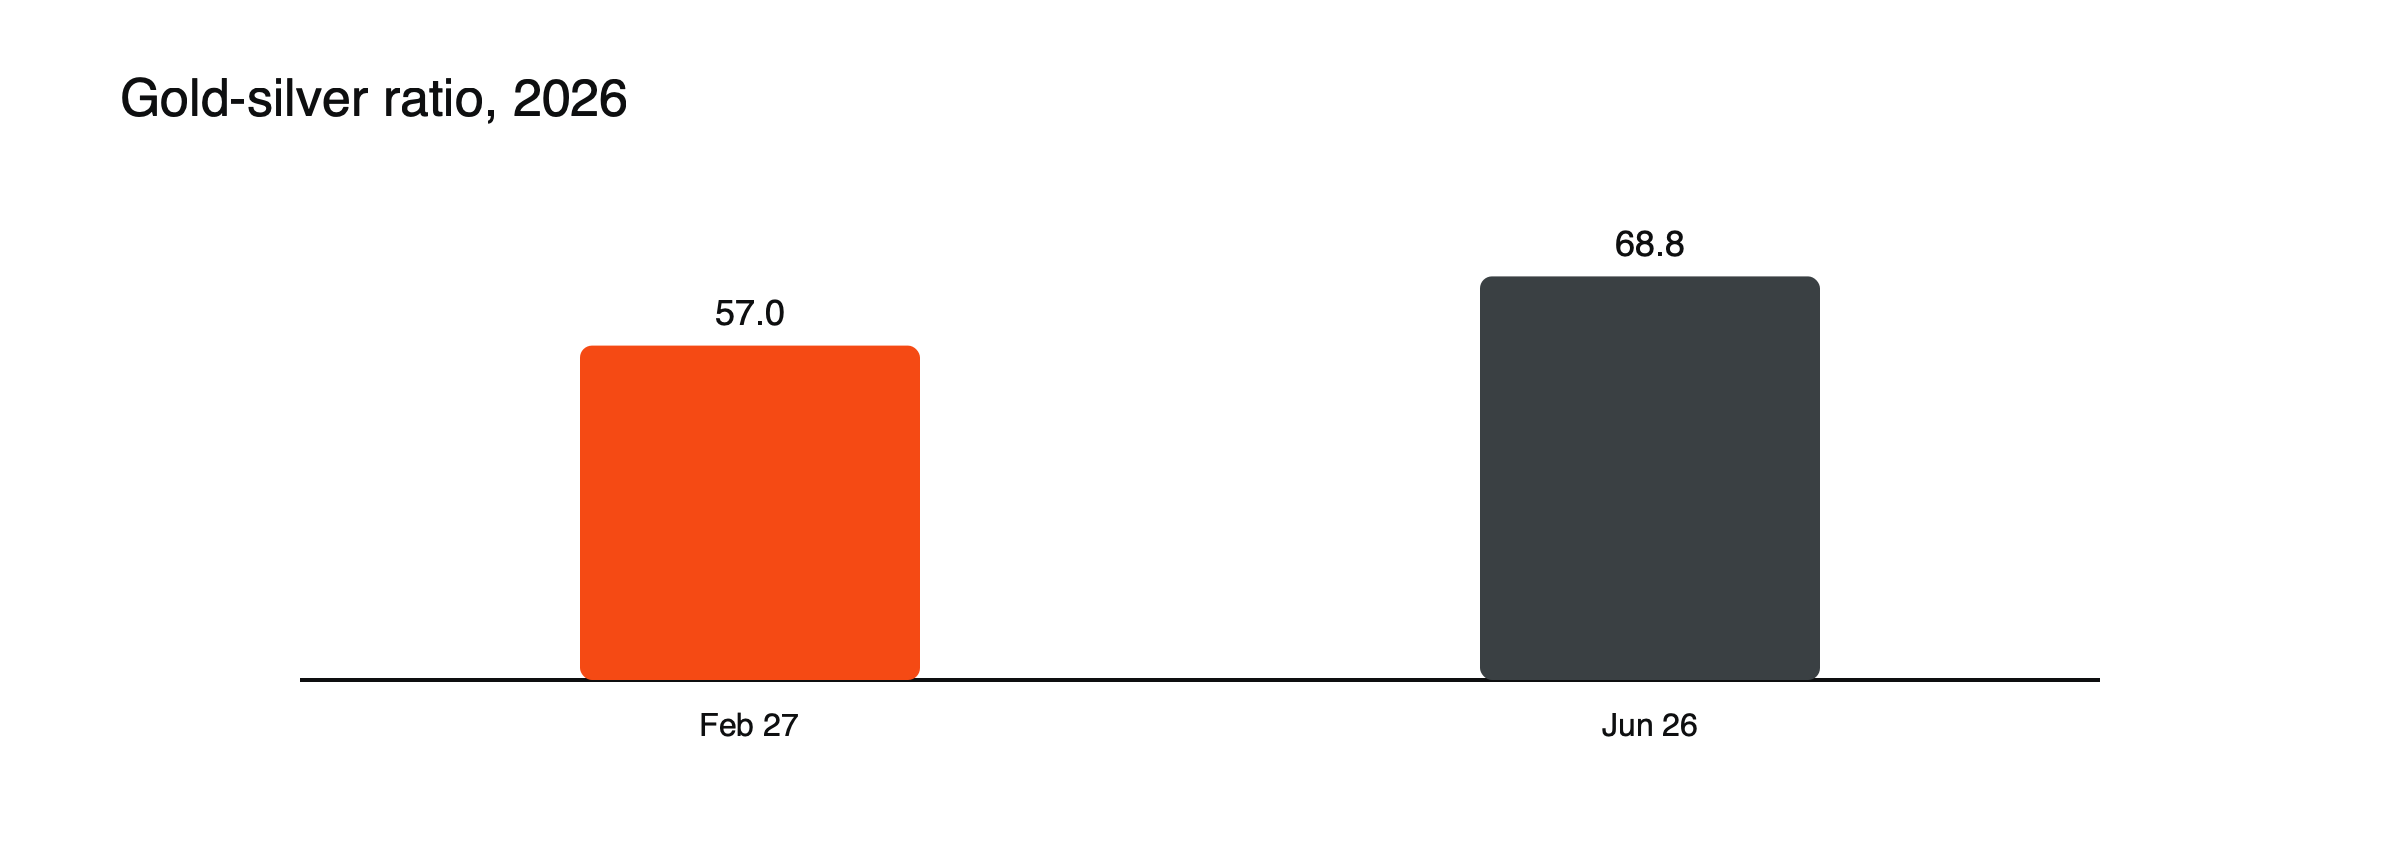
Figure: The ratio in 2026. Source: USAGOLD.
How traders use it
- Relative value: some traders buy silver and sell gold when the ratio is historically high, betting it will fall, and the reverse when it is low.
- Cycle signal: silver often lags gold early in rallies, then catches up, compressing the ratio.
- Allocation: investors use it to choose between metals.
A worked ratio trade (illustration)
If the ratio falls from 80 to 70 with gold unchanged, silver has risen about 14% relative to gold (80 ÷ 70 − 1). A position long silver and short gold of equal value would gain roughly that amount, before costs.
A ratio trade, sized and worked through
Using the June 26, 2026 prices, a trader opens a position worth $20,000 on each side: long about 338.8 ounces of silver at $59.04 and short about 4.92 ounces of gold at $4,063.17. The ratio is 68.8. Suppose the ratio falls to 60 while gold stays at $4,063.17. Silver must rise to about $67.72, a gain of about 14.7%, or roughly $2,940 on the silver leg, while the gold leg is flat. If instead gold rose and silver stayed flat, the ratio would rise and the position would lose. (Illustrative trade; real results depend on both prices.)
Margin for both legs
Under EU retail rules, gold carries a 5% margin at 20:1 and silver a 10% margin at 10:1. In the example, the silver leg needs about $2,000 and the gold leg about $1,000, a total of around $3,000 for $40,000 of combined exposure. Because both legs are leveraged, a sharp move against the trade in either metal can quickly use up that margin, even if the ratio eventually moves the expected way.
Costs of holding a ratio position
A ratio trade involves two positions, so it pays two sets of spreads and, if held overnight, financing on both legs. Depending on the provider, the short gold leg may earn a small credit or pay a charge, while the long silver leg usually pays. Over weeks or months, these costs can take a meaningful share of the expected gain, so they belong in the plan before the trade is opened. See how CFD overnight financing works.
Limits
The ratio has no fixed «fair» level; it ranged above 100 and below 60 within about a year. Both legs carry leverage and costs, and silver’s volatility means losses can grow quickly.
See gold vs silver: how their drivers differ, how much margin you need for one lot of gold and how commodity CFDs work.
The ratio over the long run
For centuries, governments fixed the value of gold against silver: in 1792, US law set it at about 15 to 1. Since metals began trading freely, the ratio has moved over a much wider range, rising above 100 in moments of stress, such as March 2020 and again in 2025, and falling to the 60s or below in strong silver rallies. That history shows why there is no natural level to which it must return.
When the ratio tends to rise
The ratio often rises in recessions and financial stress, when industrial demand for silver weakens and investors favor gold’s deeper, safer market. It tends to fall during strong precious metals rallies, when silver catches up with and then outpaces gold. Watching the economic outlook alongside the ratio helps judge whether a high reading reflects temporary fear or lasting weakness in silver demand.
Worked example: the ratio rises instead
Take the same $20,000-per-side position opened at a ratio of 68.8. If the ratio rises to 80 with gold unchanged at $4,063.17, silver must fall to about $50.79, a drop of about 14%, costing roughly $2,800 on the silver leg. The loss is similar in size to the gain if the ratio had fallen to 60, which shows that a ratio trade is a two-way bet on relative performance, not a safe position. (Illustrative trade.)
Using the ratio without shorting
Many investors use the ratio only to decide which metal to hold. When the ratio is high, they favor silver; when it is low, they switch toward gold. Over long periods, moving between the metals this way can increase the number of ounces held, if the ratio swings back and forth. The approach avoids the costs and risks of a short position, though it still depends on the ratio moving as expected.
Reading the ratio on a chart
Many charting platforms can plot gold divided by silver directly. Looking at the ratio over several years shows its typical range and how fast it can move. Marking periods of economic stress on the chart makes the link between recessions and a rising ratio easy to see. Because the ratio is a quotient of two prices, a flat ratio can hide large moves in both metals.
Other precious metals ratios
Traders also follow ratios such as gold to platinum, which compares two metals with very different demand patterns. Platinum is used mainly in industry, especially in vehicle exhaust systems, so its ratio with gold reflects the industrial outlook even more strongly than silver’s.
Common misreadings
- Assuming the ratio must return to a past average.
- Forgetting that both legs carry their own price risk.
- Ignoring the costs of holding two positions.
The ratio across the cycle, illustrated
Suppose a recession scare hits. (Illustrative scenario.) Gold rises 3% as investors seek safety, while silver falls 5% on worries about industrial demand. With gold at $4,000 and silver at $50 beforehand, the ratio was 80; afterward, with gold at $4,120 and silver at $47.50, it is about 86.7. A month later, when the scare fades and manufacturing data improve, silver rebounds faster than gold and the ratio falls back. Ratio swings like these reflect changes in the economic outlook as much as changes in precious metals demand.
A ratio routine
Once a week, note the ratio, its range over the past year and any change in the economic outlook. Mark the levels at which you would consider favoring one metal over the other, and the evidence you would want to see before acting. Writing these down in advance makes decisions more consistent and stops the ratio becoming a reason for impulsive trades. Reviewing those notes after a few months shows whether the ratio actually helped your decisions or simply added another number to watch. Recorded evidence usually beats intuition when choosing between two volatile metals.
Frequently asked questions
What is a normal gold-silver ratio?
There is no fixed normal level. In recent decades it has often traded between about 50 and 90, but it has moved well outside that range at times.
Do I need to trade both metals to use the ratio?
No. Many traders use the ratio only as a guide to which metal looks relatively cheap, then trade one of them.
Leverage, margin and cost figures in this article are example values for illustration. Actual terms depend on the provider, the instrument and the rules in your country.
This article is educational content and does not constitute financial, investment, legal or tax advice. Digital assets are volatile and you may lose the amount you invest.
Sources
- Gold rebounds above $4,060 (gold $4,063.17 and silver $59.04, ratio near 68.8, June 26, 2026) — USAGOLD
- Gold spot price surges past $5,246 (silver $92.02; ratio 57.0, February 27, 2026) — USAGOLD
- Precious metals outlook 2026 (gold/silver ratio breached 100 in 2025, then traded at or below 60; silver above $60) — CME Group, 2026
- ESMA adopts CFD measures (gold 20:1; commodities other than gold 10:1) — Finadium