
Gold vs Silver: How Their Drivers Differ
Gold is driven mostly by investment and central bank demand; silver also by industry, so it is more volatile and more tied to the economy. A comparison.
Gold vs silver differ in who buys them. Gold demand comes mainly from investors, central banks and jewelry, so it trades as a monetary and safe-haven asset. Much silver demand is industrial, from electronics and solar, so it is tied more to the economy and far more volatile. Silver doubled in 2025; gold rose about 60%.
Side by side
| Gold | Silver | |
|---|---|---|
| Main demand | Investment, central banks, jewelry | Industry, investment, jewelry |
| Central bank buying | Large | Negligible |
| Sensitivity to economy | Lower | Higher |
| Volatility | Lower | Higher |
| Market size | Larger, deeper | Smaller, thinner |
| LBMA benchmark | Twice daily | Once daily |
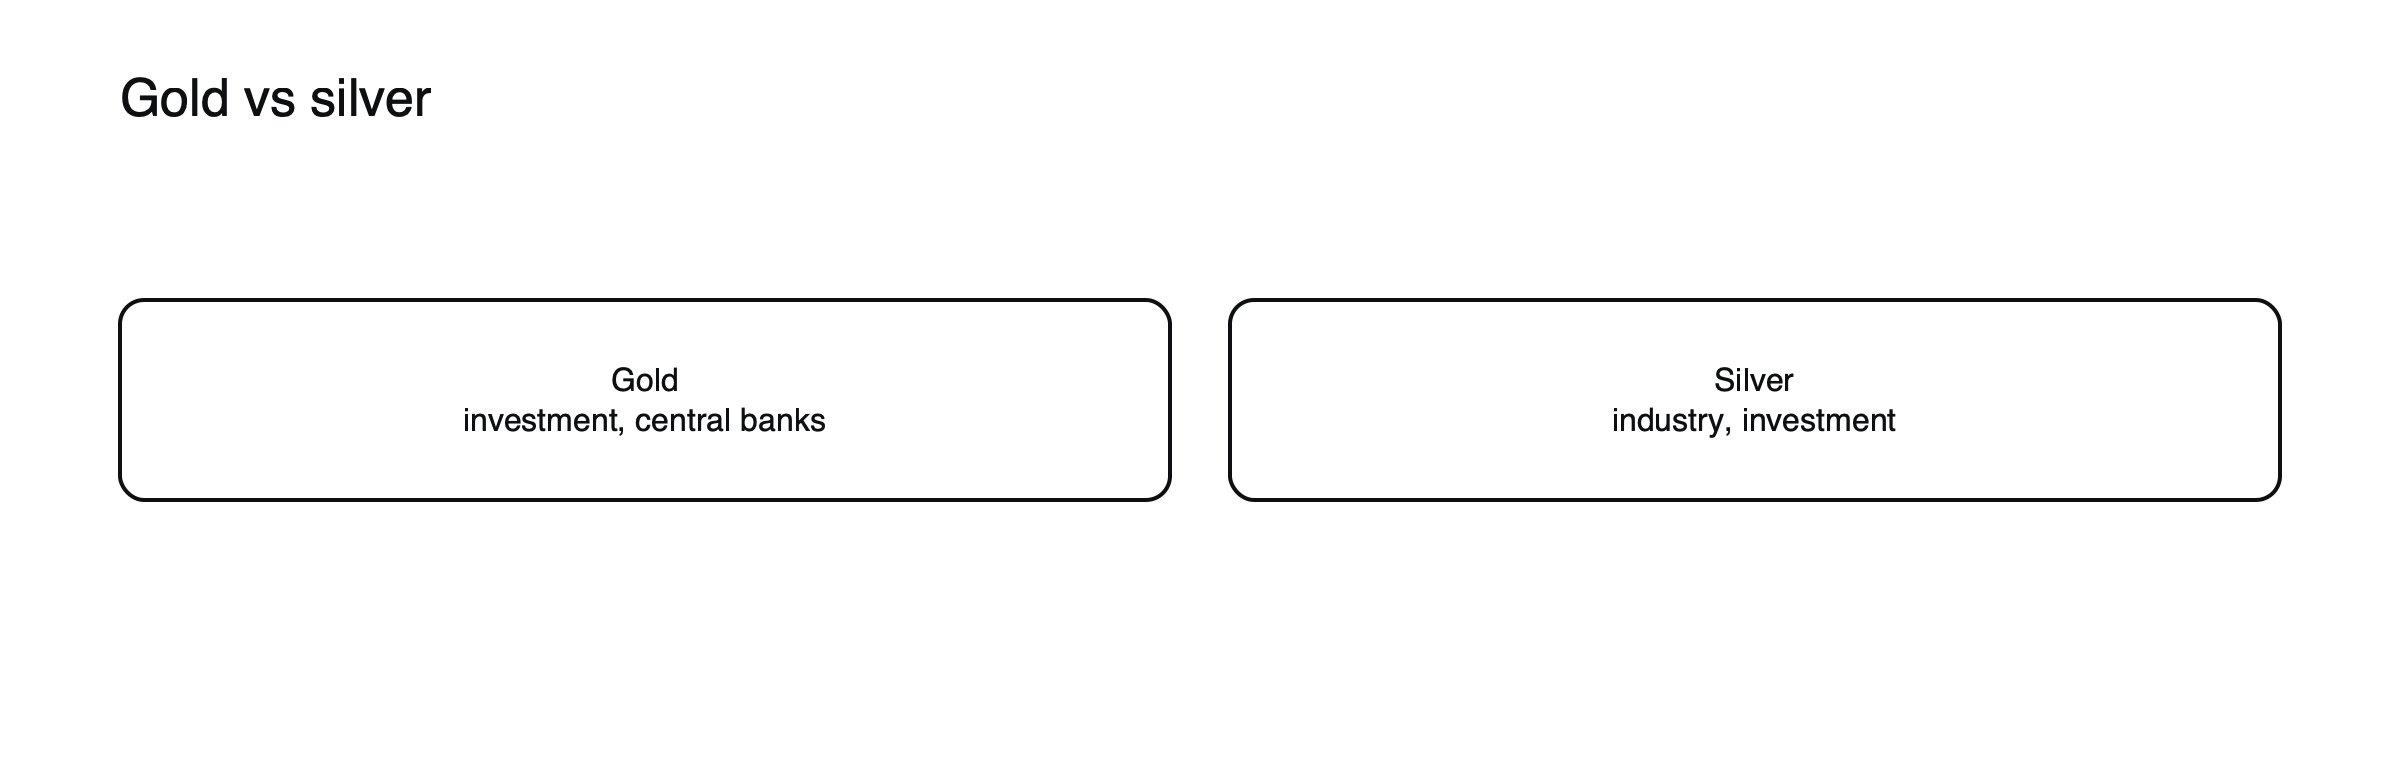
Figure: Different buyers, different behavior.
What drives silver more
Industrial demand, especially from solar and electronics, and supply deficits. Silver often lags gold early in a rally, then moves faster. See how to calculate and use the gold-silver ratio.
What drives gold more
Real interest rates, the dollar, central bank reserve buying and safe-haven demand. See what moves gold prices.
Recent example
Silver topped $109 an ounce in January 2026 and traded near $59 by late June; gold went from above $5,100 to about $4,060 over a similar period. Silver’s swings were much larger in percentage terms.
Volatility in numbers
Silver reached $109.33 an ounce on January 26, 2026, and traded at $59.04 on June 26, a fall of about 46%. Gold, which set a record above $5,100 in January, was at $4,063.17 on the same June day, roughly 20% below that level. Both fell sharply, but silver’s decline was more than twice as large in percentage terms. The same pattern usually holds on the way up: silver doubled in 2025 while gold rose about 60%.
Market size and liquidity
The gold market is far larger and deeper than the silver market, with central banks, large funds and a huge physical trade in London. Silver’s smaller market means the same flow of money moves its price more, spreads can widen faster in stress and sudden squeezes are more likely. For traders, that means larger moves, higher costs relative to the position and more care needed with stops.
Silver’s industrial side
A large share of silver demand comes from industry: electronics, electrical components and solar panels, where silver’s conductivity is hard to replace. That demand ties silver to manufacturing and the energy transition, which gold barely touches. When the economic outlook improves, silver can outperform; when it weakens, industrial demand can drag silver down even if investors are buying precious metals as havens. See what moves silver prices.
When silver and gold part ways
In a recession scare, silver can fall with industrial metals even when gold rises as a haven.
Leverage and CFD differences
Under EU retail rules, gold CFDs carry a maximum leverage of 20:1, while silver, like other commodities, is capped at 10:1. Silver positions therefore need twice as much margin for the same value. Combined with silver’s larger moves, that makes position sizing especially important: a silver position of the same value as a gold position typically carries much more risk. See how much margin you need for one lot of gold.
Different roles in a portfolio
Investors who hold precious metals for stability often prefer gold, because of its deeper market, central bank support and lower volatility. Silver appeals to those who want more sensitivity to both precious metal trends and economic growth, accepting larger swings. Some hold both and adjust the balance using the gold-silver ratio. See how to calculate and use the gold-silver ratio.
Which suits a trade?
For a view on interest rates, the dollar or safe-haven demand, gold is usually the cleaner expression. For a view on industrial demand or a strong precious metals rally broadening out, silver may respond more. Whichever is chosen, sizing should reflect its own volatility rather than the other metal’s.
Sizing gold and silver for equal risk
Suppose gold typically moves 1.5% a day and silver 3%. (Illustrative figures.) A gold position worth $20,000 then swings about $300 on a typical day. To carry the same daily risk, a silver position should be worth about $10,000, since 3% of $10,000 is also $300. Holding equal amounts of money in both would give silver twice the influence on the account’s swings. Sizing by volatility rather than by value keeps the two positions comparable.
In a downturn
When the economic outlook darkens, gold often holds up or rises as investors seek safety, while silver can fall alongside industrial metals as manufacturing demand weakens. The gap between them can widen quickly, which is why the gold-silver ratio tends to rise in recessions. In strong recoveries, the reverse often happens, with silver outperforming as both investment and industrial demand pick up.
Supply differences
Gold is mostly mined for its own sake, so miners can respond, slowly, to higher prices. Most silver is a by-product of mining other metals, such as zinc, lead and copper, so its supply depends largely on those markets rather than on the silver price. That difference makes silver supply less responsive, and helps explain the persistent deficits of recent years.
Investment demand
Both metals are bought as investments through bars, coins and funds, but gold’s investment market is far larger. Silver’s investment flows, though smaller in money terms, can move its price more because of its smaller market size. Retail enthusiasm, sometimes spread through online communities, has occasionally driven sudden spikes in silver that had no parallel in gold.
Common misreadings
- Treating silver as cheap because its price per ounce is low.
- Expecting silver to follow gold in a recession.
- Sizing silver positions like gold positions.
The 2025–2026 cycle compared
Over 2025, silver roughly doubled while gold rose about 60%. In January 2026, both set records, silver above $109 and gold above $5,100. By late June, silver had given back about 46% and gold about 20%. The pattern, silver lagging, then catching up, then outpacing gold on the way down, is common in precious metals cycles and shows why many traders treat silver as a higher-risk version of the same theme.
Trading hours and costs
Both metals trade almost around the clock on weekdays through CFDs that follow London and New York markets. Spreads on silver are usually wider relative to its price than spreads on gold, especially outside the busiest hours. Financing costs on long positions depend on the provider’s rates. Comparing costs as a percentage of position value, rather than in points, gives a fair comparison between the two. Over a year of active trading, those cost differences can add up to a meaningful share of results, so they deserve a place in any comparison alongside volatility and leverage limits. Small differences per trade become surprisingly large over hundreds of trades.
Frequently asked questions
Is silver cheaper than gold to trade?
The price per ounce is much lower, but contract sizes, spreads and margin rules differ, and silver’s larger moves usually mean more risk per unit of money invested.
Does silver always follow gold?
Often in direction, but not always in size or timing. Its industrial demand can pull it away from gold, especially when the economic outlook changes.
This article is educational content and does not constitute financial, investment, legal or tax advice. Digital assets are volatile and you may lose the amount you invest.
Sources
- Precious metals outlook 2026 (gold/silver ratio breached 100 in 2025, then traded at or below 60; silver above $60) — CME Group, 2026
- Gold surges past $5,000 and silver tops $100 (silver $109.33 on January 26, 2026; gold +60% and silver doubled in 2025) — Barchart
- Gold rebounds above $4,060 (gold $4,063.17 and silver $59.04, ratio near 68.8, June 26, 2026) — USAGOLD
- ESMA adopts CFD measures (gold 20:1; commodities other than gold 10:1) — Finadium