
How to Compare ETFs That Track the Same Index
Compare the expense ratio, tracking difference, spreads and volume, size, replication and dividend policy: how to choose between ETFs that track the same index.
To compare ETFs that track the same index, check the expense ratio, the tracking difference over several years, the bid-ask spread and trading volume, the fund’s size, its replication method and dividend policy, and the currency and domicile. S&P 500 ETFs, for example, charge from 0.02% to 0.0945% a year, and small fee gaps add up over time.
Before you start
List every ETF that tracks the index you want, including different share classes and listings.
Comparing them, step by step
Expense ratio
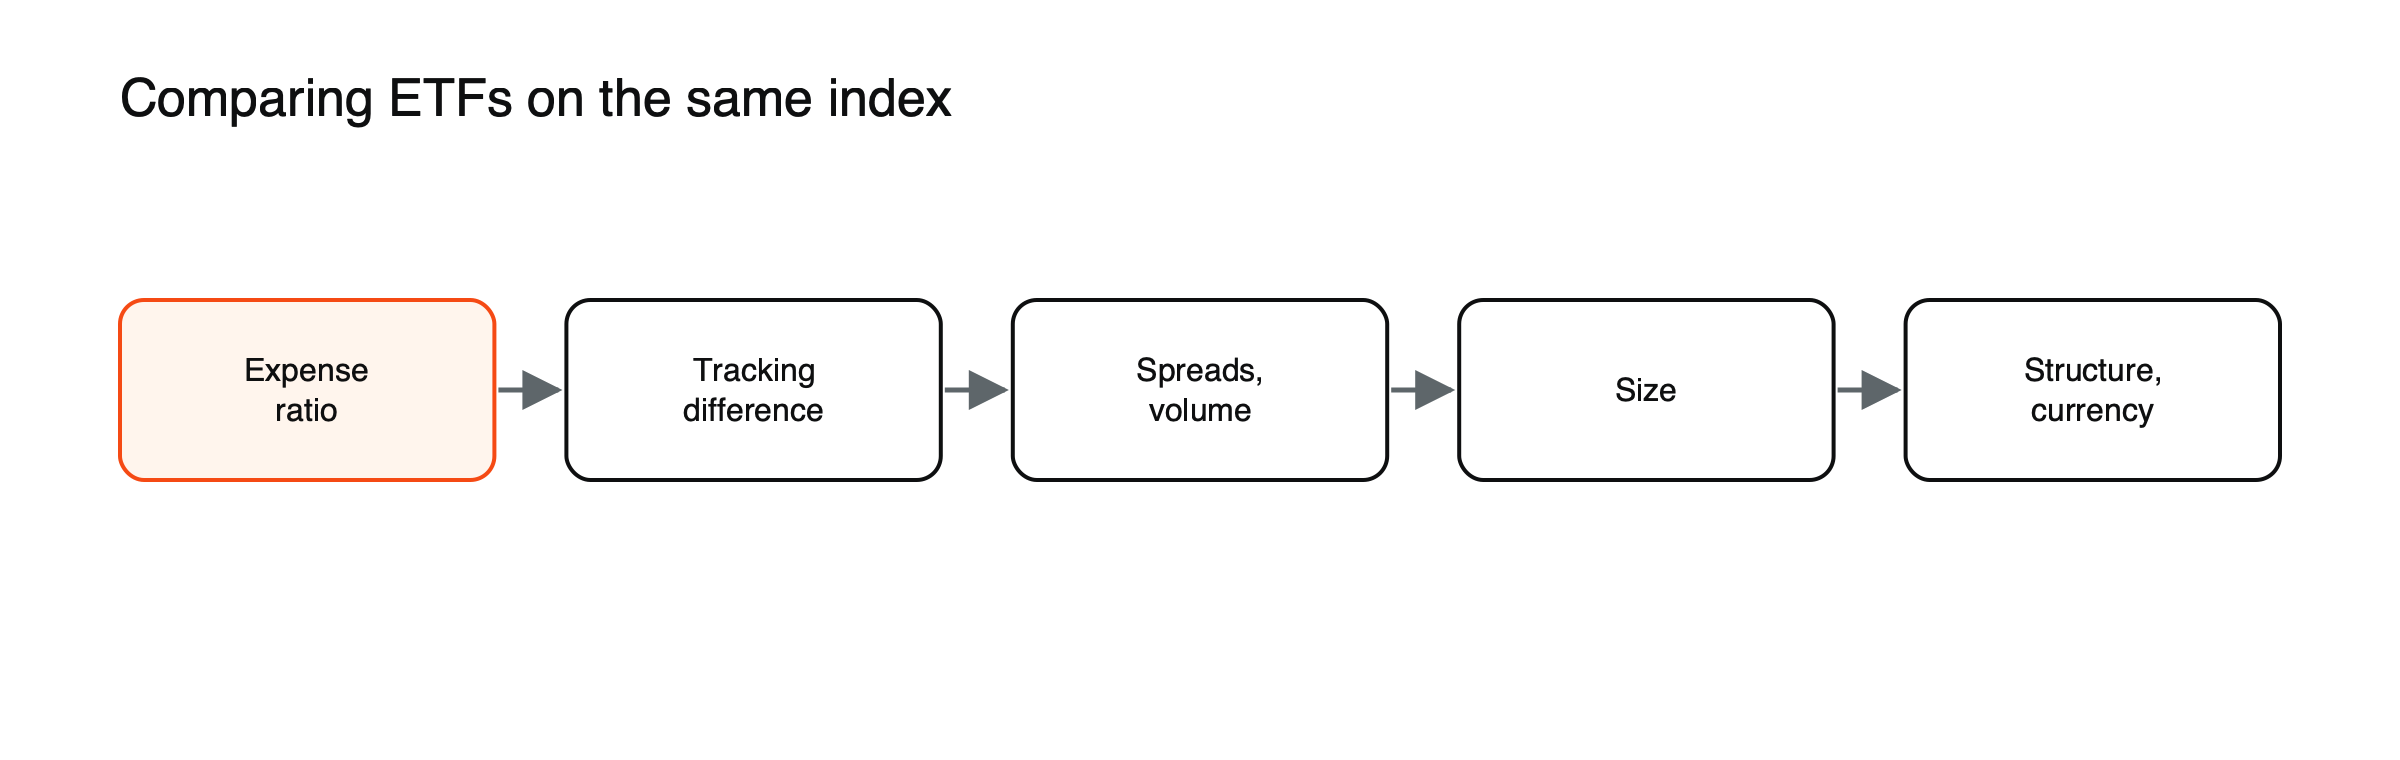
Figure: Comparing same-index ETFs.
The starting point for costs. See how much an ETF’s expense ratio costs over 10 years.
Tracking difference
The actual return gap versus the index over several years, which captures all costs. See what tracking difference is.
Spreads and volume
Tight spreads matter if you trade often; the most traded funds, such as SPY, are favored by active traders even with higher fees.
Fund size
Larger funds are less likely to close and often trade more efficiently.
Replication and lending
Physical or synthetic, and whether securities are lent out. See physical vs synthetic ETFs.
Dividend policy, currency and domicile
Accumulating or distributing, trading currency and tax treatment. See accumulating vs distributing ETFs.
Three S&P 500 funds compared
The three largest US-listed S&P 500 ETFs show how the steps work in practice. Two charge 0.03% a year; the oldest, launched in 1993, charges 0.0945%. Since 2010, the cheapest funds’ total returns have been slightly ahead of the oldest fund’s, broadly reflecting the fee gap. Yet the oldest fund remains heavily used by active traders and institutions, because its very high trading volume, tight spreads and deep options market make it cheaper to trade frequently in large size. For a long-term investor buying a few times a year, the lower fee matters most; for a trader moving large sums daily, liquidity can matter more.
Holding period changes the answer, illustrated
Suppose Fund A charges 0.03% a year with a typical spread of 0.02%, and Fund B charges 0.09% with a spread of 0.005%. (Example values.) For a $10,000 investment held ten years, Fund A’s extra spread costs about $1.50 once, while Fund B’s extra fee costs roughly $60 over the decade, so Fund A wins clearly. For a trader buying and selling $10,000 twenty times a year, Fund A’s wider spread costs about $30 more a year, while Fund B’s higher fee costs about $6 more, so Fund B wins. The best fund depends on how it will be used.
A simple scoring table
| Factor | Fund A | Fund B | Fund C |
|---|---|---|---|
| Expense ratio | 0.07% | 0.12% | 0.20% |
| 5-year tracking difference | −0.09% | −0.10% | −0.28% |
| Fund size | $12 billion | $3 billion | $400 million |
| Typical spread | 0.02% | 0.03% | 0.10% |
| Replication | Physical | Physical | Synthetic |
| Share class wanted available | Yes | Yes | No |
(Hypothetical funds tracking the same index.) Fund A leads on most measures. Fund B is close and could be preferred if, for example, it is domiciled more favorably for tax. Fund C is smaller, costlier and tracks worse, and lacks the share class needed, so it drops out.
Common mistakes
Choosing on fees alone without checking tracking, and ignoring currency and tax effects. See how to read an ETF factsheet and what an ETF is.
Checking several share classes and listings
The same fund may be listed on several exchanges, in different currencies, and in accumulating or distributing classes. Spreads and volumes differ between listings, so buying on the exchange and in the currency with the most trading usually keeps costs lowest. Currency-hedged classes are separate funds for comparison purposes, with their own costs and tracking.
Where to find the data
Providers’ websites and factsheets give fees, size, replication and distribution policy. Tracking difference can be calculated from the annual returns shown on factsheets. Spreads and volumes are available from brokers and exchanges. Independent fund research sites compile much of this in one place. See how to read an ETF factsheet.
When the differences are tiny
For the largest funds tracking major indices, differences between providers are often a few hundredths of a percent a year. In those cases, convenience, the share class wanted, the currency and the broker’s charges may decide the choice. Spending hours to save $5 a year on a modest investment is rarely worthwhile; avoiding a fund that lags by 0.3% a year is.
Same name, different index
Funds described in similar terms may track different indices. Two US large-company funds may follow the S&P 500 and a broader large-cap index with several hundred more members; two global funds may differ in whether they include emerging markets or small companies. Before comparing costs, confirm that the funds track exactly the same index, or decide which index you actually want.
Currency-hedged versions
Hedged share classes remove most of the effect of exchange rates but add hedging costs or gains, which depend on interest rate differences between currencies. Compare hedged classes with each other and with the hedged version of the index, not with unhedged funds.
Lending and collateral policies
Funds that lend securities earn extra income that can improve tracking, but policies differ in how much is lent, what collateral is accepted and how income is shared between the fund and the provider. Factsheets and annual reports disclose these details for those who want to compare them.
Broker costs
Some brokers offer certain ETFs commission-free, or charge different fees on different exchanges. A fund that is slightly cheaper to hold may cost more overall if buying it incurs commissions each time, especially for regular small purchases.
Keeping a comparison sheet
A simple spreadsheet with one row per fund and columns for index, fee, tracking difference, size, spread, replication, share class and domicile makes comparisons quick and repeatable, and is easy to update once a year.
Common misreadings
- Treating funds with similar names as interchangeable.
- Comparing hedged and unhedged classes directly.
A worked choice, illustrated
A euro-based investor wants S&P 500 exposure through a UCITS ETF and finds three candidates. Fund A charges 0.07%, is accumulating and domiciled in Ireland, with a five-year tracking difference of about −0.02% thanks to favorable treatment of US dividend taxes. Fund B charges 0.05% but is distributing, which the investor does not want. Fund C charges 0.07% and is synthetic, with a tracking difference of about +0.05%. (Hypothetical funds.) Fund A and Fund C both fit; the investor chooses Fund A for its physical holdings and simpler structure, accepting a slightly worse tracking record.
Domicile and tax
Where a fund is domiciled can change how much tax is withheld on dividends from the companies it holds, which shows up in tracking difference. For investors in some countries, it also affects personal taxes on the fund. Checking domicile alongside fees is part of a fair comparison.
When to recheck
Fees, sizes and tracking change over time. Reviewing a chosen fund against alternatives once a year keeps the choice current without constant switching.
Two common traps
The first is comparing funds over different periods, for example one fund’s five-year record with another’s three-year record, which can make either look better by accident. The second is relying on a single year’s tracking difference, which can be distorted by one-off events such as a large index change or a tax refund. Using exactly the same periods for every fund, and at least three to five years of returns data where available, gives a fair, like-for-like comparison. Newer funds without long records can still be compared on fees, structure and the provider’s track record with its other similar funds.
Frequently asked questions
Is the oldest or largest fund always best?
No. Size helps with liquidity and closure risk, but newer, cheaper funds can deliver better returns for long-term holders.
Should I switch if a cheaper fund appears?
Only if the saving outweighs the costs of switching, including spreads and any taxes on gains.
This article is educational content and does not constitute financial, investment, legal or tax advice. Digital assets are volatile and you may lose the amount you invest.