
What Does an Inverted Yield Curve Mean?
An inverted yield curve means short-term yields exceed long-term ones, usually as markets expect cuts. It preceded past recessions, but 2022–2024 did not. Why.
An inverted yield curve means short-term government yields are above long-term ones, usually when central banks hike to fight inflation while investors expect slower growth and later cuts. The 2-year/10-year curve inverted before each of five US recessions since 1976, but its 26-month 2022–2024 inversion had no recession by 2026.
Why the curve inverts
- Tight policy now: high short-term rates set by the central bank.
- Expected cuts later: long yields reflect the expected path of rates, which falls if markets see a slowdown.
- Demand for long bonds as a hedge against weaker growth.
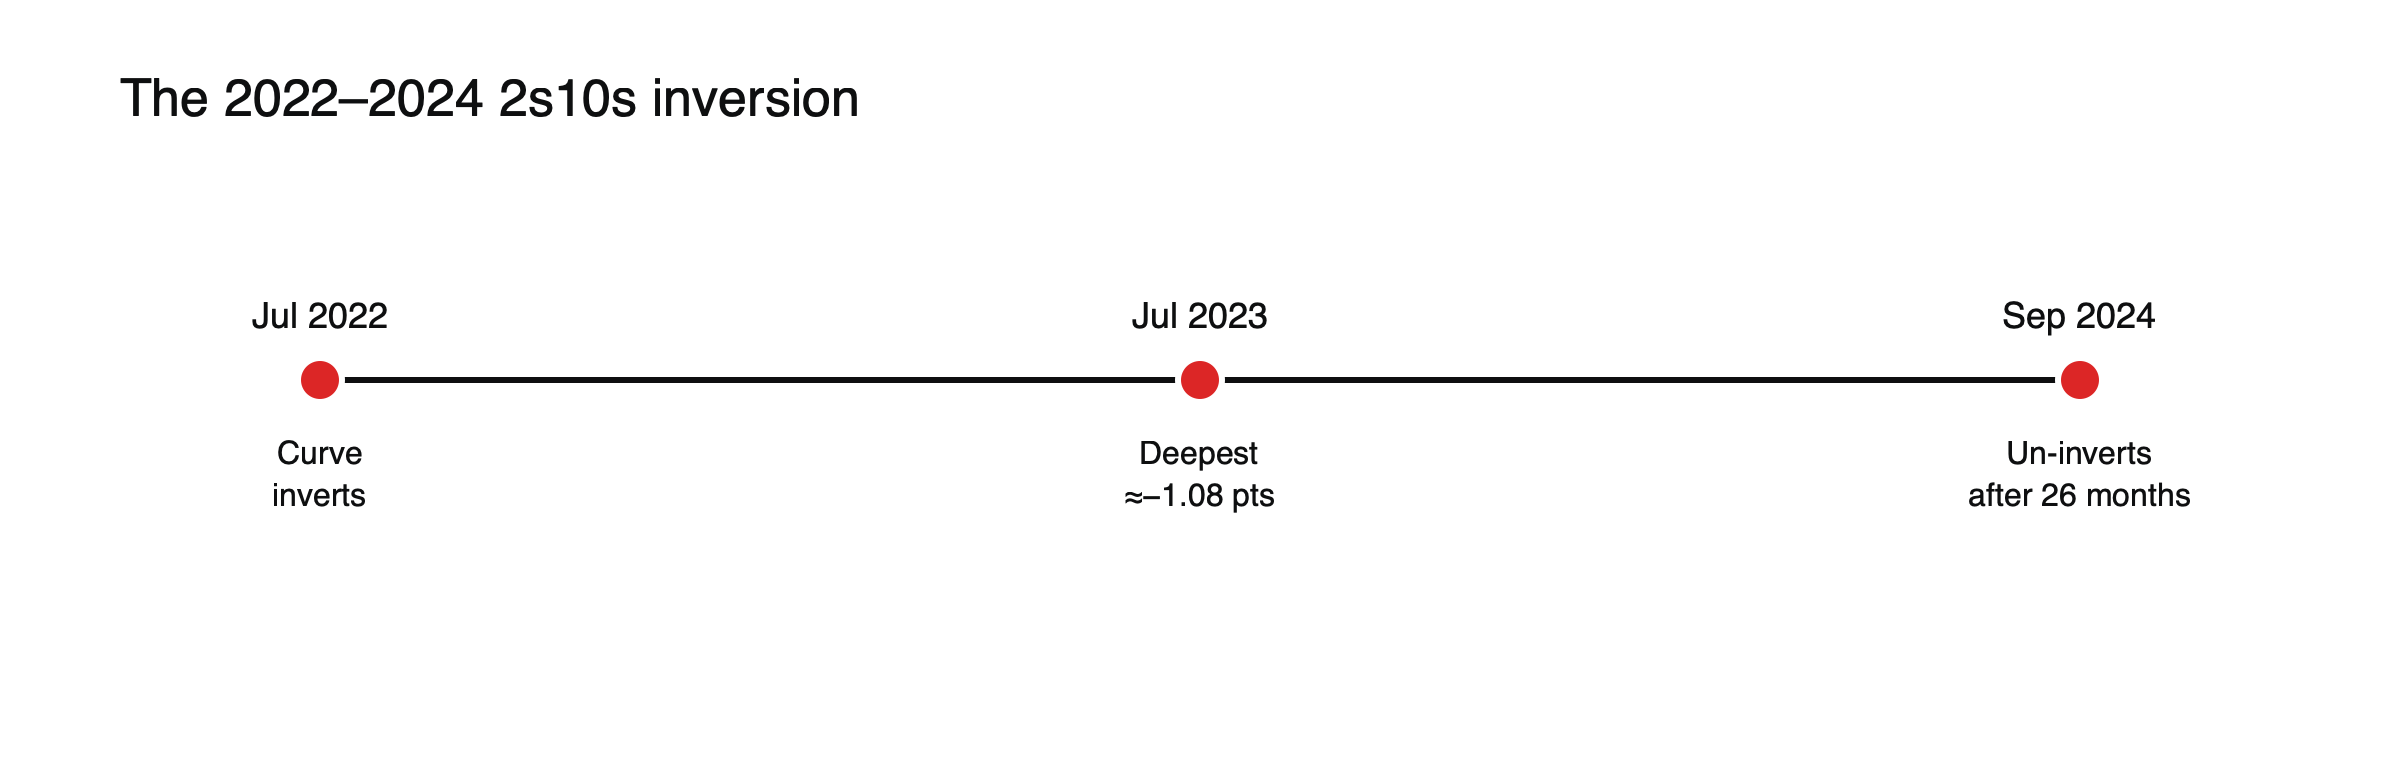
Figure: The 2022–2024 inversion. Sources: Eco3min; TheTrading.Tools.
The 2022–2024 inversion, in numbers
The 2-year/10-year curve inverted in July 2022 as the Federal Reserve raised rates rapidly. The inversion deepened to about −1.08 points in July 2023, the deepest in decades, and lasted 26 months before the curve un-inverted in September 2024. Despite the depth and length, the United States had not entered a recession as of 2026, a striking exception to the historical pattern.
Why it has been a recession signal
Inversions squeeze bank lending margins, signal tight financial conditions and reflect market expectations of weaker growth. Historically, recessions began months to more than a year after inversion, often after the curve re-steepened.
Why 2022–2024 was different
Strong household finances, fiscal support and an economy less sensitive to rates helped avoid recession; some argue the curve was distorted by years of central bank bond buying.
Which part of the curve
The 2-year/10-year spread is the most quoted measure, but some economists prefer the gap between the 3-month bill and the 10-year note, which has a long record as a recession signal in research. The two measures usually invert together, but their timing can differ. Watching both, and how deeply and for how long each inverts, gives a fuller picture.
Banks and lending
Banks borrow at short-term rates and lend at longer-term rates. An inverted curve squeezes that margin, which can make banks less willing to lend, tightening credit across the economy. That is one channel through which an inversion can help bring about the slowdown it predicts.
What traders watch
The depth and length of inversion, and especially when it un-inverts, which in past cycles came close to the start of recessions. See what happens when the yield curve un-inverts.
Limits
Lags are long and variable, and false signals happen. Use it with other indicators. See recession indicators and their track record and what the yield curve is.
After un-inversion
In past cycles, the curve often re-steepened sharply just before or as a recession began, because central banks cut short-term rates in response to weakening growth. Short yields fell faster than long ones, a pattern known as a bull steepening. The 2024 un-inversion came as the Fed began cutting, but without an accompanying recession, at least through 2026.
Inversions elsewhere
Curves in other countries, such as the UK and Germany, also inverted in 2022 and 2023 as their central banks raised rates. Their record as recession signals is less studied than the US curve’s, and economies with different structures may respond differently to tight policy.
Trading around an inversion
Traders use inversions as context rather than signals to act on alone. During inversions, many reduce exposure to economically sensitive sectors, watch bank shares and credit spreads, and position for eventual steepening through curve trades. The long and variable lags mean that acting too early can be costly, as shares rose strongly through much of the 2022–2024 inversion.
A checklist
- Which part of the curve is inverted, and by how much?
- How long has it lasted?
- Is the curve starting to re-steepen, and why?
- What are credit spreads, bank lending and employment showing?
Why long yields stay lower
During an inversion, long yields stay below short yields because investors expect today’s high policy rates to fall eventually. They are willing to lock in a somewhat lower long-term yield rather than risk reinvesting at lower rates later. Strong demand for long bonds from pension funds, insurers and foreign buyers can add to the effect, keeping long yields lower than policy rates alone would suggest.
Inversions and shares
Share prices have often risen for months after an inversion begins, because recessions, when they come, arrive with long lags. Investors who sold shares as soon as the curve inverted have frequently missed significant gains. Shares have tended to come under more pressure later, when the curve re-steepens and economic data weaken.
Inversions and the dollar
Inversions usually occur when the central bank is raising rates aggressively, which often coincides with a strong currency, as with the dollar in 2022. As the curve re-steepens and rate cuts approach, the currency can weaken.
Using the signal in a portfolio
Rather than making sudden changes, some investors use inversions to review risk gradually: checking exposure to economically sensitive sectors, adding to high-quality bonds as yields peak and making sure portfolios could withstand a downturn. Treating the inversion as one input among many, alongside employment, credit spreads and earnings, avoids overreacting to a signal with uncertain timing.
Common misreadings
- Selling everything as soon as the curve inverts.
- Assuming the signal has stopped working after one miss.
Depth and length
Not all inversions are alike. A brief, shallow inversion of a few hundredths of a point may reflect technical factors; a deep, long inversion, such as the 2022 to 2024 episode, reflects a sustained gap between current policy and expected future rates. Many analysts give more weight to inversions that are both deep and long, though even those, as the latest episode showed, do not guarantee a recession.
Indicators to watch alongside
Because the curve’s signal is imperfect, investors combine it with other indicators: unemployment claims, manufacturing surveys, credit spreads, bank lending standards and corporate profit trends. A recession signal from the curve backed by rising unemployment and widening spreads is far more convincing than an inversion alone. See recession indicators and their track record.
The risk after un-inversion
The period after the curve returns to a positive slope has historically been the riskiest for the economy, because steepening often reflects central banks cutting rates as conditions weaken. Investors who relaxed once the inversion ended were sometimes caught by the downturn that followed.
The central bank’s response
Markets watch how the central bank reacts to an inversion. If it keeps rates high to finish the fight against inflation, the inversion can persist; if growth weakens and it cuts, the curve re-steepens. Statements about the path of rates, and data on inflation and employment, therefore matter more for the curve’s next move than the inversion itself.
What an inversion means for savers and borrowers
During an inversion, savers can often earn more on short-term deposits and Treasury bills than on longer bonds, which encourages them to stay short. Borrowers may find long-term fixed rates cheaper than variable rates tied to short-term policy, which can make locking in a long-term loan attractive. Both behaviors reflect the market’s expectation that short rates will fall.
Inversions and credit
Inversions often coincide with tightening credit conditions: banks raise lending standards, spreads on riskier borrowers widen and refinancing becomes harder. Watching credit markets alongside the curve shows whether tight policy is feeding through to the wider economy.
A brief history of the signal
Economists began studying the yield curve as a predictor of recessions in the late 1980s, and its success in the following decades made it one of the best-known market indicators. The latest episode has prompted debate about whether structural changes, such as large central bank balance sheets, have weakened it. Whatever the answer, the curve remains widely watched, and most economists now treat it as one important signal among several rather than as a fully reliable recession clock.
Frequently asked questions
Does an inversion cause recessions?
Not directly. It reflects tight policy and expectations of slower growth, and it can squeeze bank lending, but other conditions determine whether a recession follows.
Why did the recent inversion not lead to a recession?
Explanations include strong household finances, fiscal support, an economy less sensitive to interest rates and distortions from years of central bank bond buying.
This article is educational content and does not constitute financial, investment, legal or tax advice. Digital assets are volatile and you may lose the amount you invest.
Sources
- 2s10s yield curve inversion history (five inversions since 1976 followed by recession; 26-month 2022–2024 inversion without one as of 2026) — Eco3min
- The Yield Curve Manual (deepest inversion −1.08 points in July 2023; un-inversion before past recessions) — TheTrading.Tools
- What is an inverted yield curve? (2022–2024 inversion followed by a bull steepener as cuts began) — Tapeboard