
How to Calculate Gross, Operating and Net Margin
Gross, operating and net margin each divide a profit line by revenue. A worked example gives 40%, 15% and 9.75%, and what each margin tells you.
Profit margins show how much of each revenue dollar a company keeps: gross margin is gross profit ÷ revenue, operating margin is operating income ÷ revenue and net margin is net income ÷ revenue. On $1 billion of revenue, $400 million gross profit, $150 million operating income and $97.5 million net income give 40%, 15% and 9.75%.
The formulas
- Gross margin = (revenue − cost of goods sold) ÷ revenue
- Operating margin = operating income ÷ revenue
- Net margin = net income ÷ revenue
Worked example (ExampleCo, $ million)
| Line | Amount | Margin |
|---|---|---|
| Revenue | 1,000 | |
| Cost of goods sold | 600 | |
| Gross profit | 400 | 40% |
| Operating expenses | 250 | |
| Operating income | 150 | 15% |
| Interest | 20 | |
| Tax (25%) | 32.5 | |
| Net income | 97.5 | 9.75% |
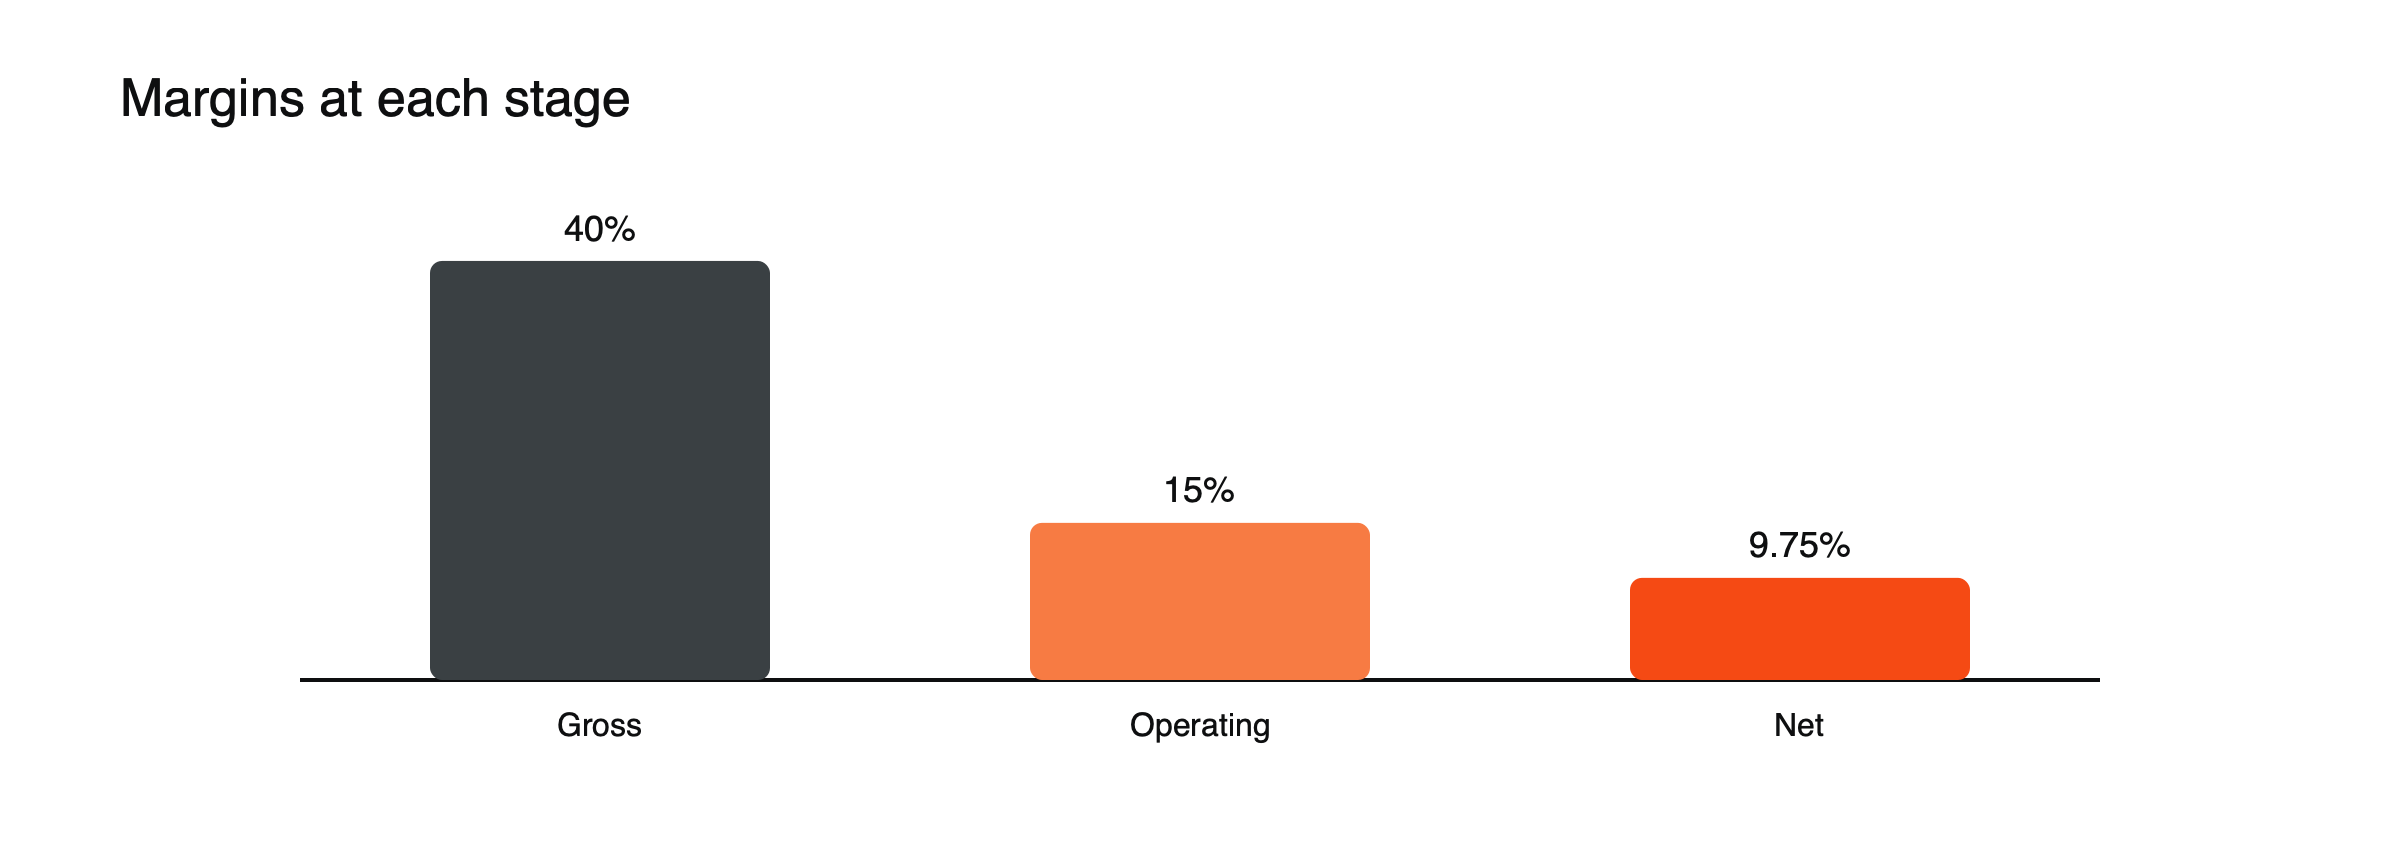
Figure: Margins at each stage (hypothetical example).
EBITDA margin
Another widely used measure is the EBITDA margin: earnings before interest, tax, depreciation and amortization, divided by revenue. ExampleCo’s operating income of $150 million plus $50 million of depreciation and amortization gives EBITDA of $200 million, an EBITDA margin of 20%. It is useful for comparing companies with different investment cycles, but because it ignores the cost of equipment, it can flatter capital-heavy businesses. (Hypothetical figures.)
What each margin tells you
- Gross: pricing power and production costs.
- Operating: how efficiently the business runs, including overheads.
- Net: what is left after financing and taxes.
A price rise, worked through
Suppose ExampleCo raises prices by 5% without losing customers or changing its costs. Revenue rises to $1,050 million, cost of goods sold stays at $600 million and gross profit rises to $450 million, a gross margin of about 42.9%. With operating expenses unchanged at $250 million, operating income jumps to $200 million, a 19% margin, up a third from $150 million. Small changes in pricing can have large effects on profit, which is why pricing power is so valuable. (Hypothetical figures.)
A cost increase, worked through
Now suppose input costs rise 10% and the company cannot raise prices. Cost of goods sold rises to $660 million, gross profit falls to $340 million and the gross margin to 34%. Operating income drops to $90 million, a 9% margin, down 40%. This is the squeeze many companies faced when inflation surged in 2021 and 2022. (Hypothetical figures.)
Why trends matter more than levels
Compare margins with the company’s own history and with peers in the same sector. Shrinking margins can hurt a stock even when revenue grows. See how earnings reports move share prices, how to read an income statement and what moves stock prices.
Margins differ by industry
Software companies can have gross margins of 70% or more, because each extra copy of a product costs little to deliver. Supermarkets often work on net margins of a few percent, relying on high volume. Capital-heavy industries such as telecoms or utilities may have strong EBITDA margins but much lower net margins after depreciation and interest. Comparing a company’s margins with those of close competitors, not with the market as a whole, gives the useful signal.
What drives margins
- Pricing power: strong brands or unique products allow higher prices.
- Scale: fixed costs spread over more sales.
- Input costs: raw materials, energy and wages.
- Product mix: shifting toward higher-margin products or services.
- Competition: new rivals often push prices and margins down.
Margins and share prices
Investors watch margin trends closely in results. Expanding margins often lead to earnings upgrades and higher valuations; shrinking margins can push a share down even when revenue beats forecasts. Company guidance on margins for the coming year is often as important as revenue guidance. See how to read an earnings report.
Common misreadings
- Comparing margins across very different industries.
- Treating a one-year margin jump as permanent.
- Looking at net margin without checking whether tax or one-off items drove it.
Operating leverage
The price and cost examples show operating leverage: because some costs are fixed, changes in revenue or input costs move operating profit far more than they move sales. A business with high fixed costs, such as a software company or a factory running below capacity, sees margins expand quickly as sales grow and shrink quickly when they fall. A business with mostly variable costs, such as a distributor, has steadier but lower margins.
Reading margins in results, illustrated
Suppose analysts expect ExampleCo to report a 15.0% operating margin for a quarter, and it reports 14.2% on revenue in line with forecasts. Operating income is about $8 million lower than expected on a $1,000 million annual run rate, or roughly 5% below forecasts. If management explains the miss as temporary, such as a one-off shipping cost, the shares may barely react; if it points to rising wages that will persist, the market may cut earnings forecasts and the shares fall. (Hypothetical figures.)
From operating to net margin
The gap between operating and net margin comes from interest and tax. ExampleCo’s operating margin of 15% becomes a net margin of 9.75% after $20 million of interest and a 25% tax rate. A company with more debt or a higher tax rate converts less of its operating profit into net income, which is why comparing operating margins is often fairer across companies with different financing.
Margins and valuation
Investors usually pay higher multiples for companies with high and stable margins, because their profits are more resilient and often reflect a strong competitive position. A company that can lift its margins toward those of better-run peers may see both its earnings and its valuation rise, a powerful combination for its share price.
A margin checklist
- How do the margins compare with peers and with the company’s history?
- Are they rising or falling, and why?
- How much of a change comes from pricing, costs or product mix?
- Is the trend likely to continue?
Margins and inflation
Inflation tests a company’s margins. Businesses with strong brands or essential products can raise prices in line with costs and protect margins; those in competitive markets often cannot, and margins shrink. During the inflation surge of 2021 and 2022, investors paid close attention to which companies could pass on higher costs, and shares of those that could not often fell sharply.
Segment margins
Large companies often report profit by segment. A company with an average operating margin of 15% might combine a 30% margin software division with a 5% margin hardware business. Growth in the high-margin segment lifts the overall margin even if the rest of the business is flat, which is why the mix of revenue can matter as much as its total.
Comparing gross margins carefully
Companies do not all classify costs the same way. Some include shipping, warehousing or certain staff costs in cost of goods sold; others report them as operating expenses. Two companies with identical economics can therefore show different gross margins. Operating margin, which includes all operating costs, is often the fairer basis for comparison between companies. Checking the accounting notes carefully before comparing gross margins avoids mistaking a classification difference for a real difference in the business.
Frequently asked questions
Which margin matters most?
Each answers a different question. Gross margin shows pricing power, operating margin shows how efficiently the business runs and net margin shows what reaches shareholders. Investors usually watch operating margin most closely.
Why can revenue grow while profits fall?
Because costs may rise faster than sales, squeezing margins, as in the cost-increase example above.
Company figures in this article are a hypothetical example (“ExampleCo”) for illustration.
This article is educational content and does not constitute financial, investment, legal or tax advice. Digital assets are volatile and you may lose the amount you invest.