
What Happened Across Markets in the 2008 Financial Crisis
In the 2008 crisis the S&P 500 fell 57% while Treasuries and gold rose and volatility hit record levels. A cross-asset timeline and what it taught investors.
Across 2008 financial crisis markets, stocks collapsed while government bonds and gold held up. The S&P 500 fell 56.8% from October 9, 2007 to March 9, 2009. US Treasuries gained about 20% in 2008 as stocks fell 37%, gold rose about 26% over the recession, and the VIX volatility index peaked near 89 in October 2008.
Timeline
- October 9, 2007: the S&P 500 peaks.
- 2007–2008: high-yield credit spreads widen well before the worst of the stock crash.
- September 15, 2008: Lehman Brothers collapses; panic spreads globally.
- September–October 2008: 34 of 42 trading days see stock moves greater than 1%; the VIX peaks near 89.
- November 2008: long-term Treasuries rise nearly 15% in a month.
- December 2008: the high-yield spread peaks near 22%.
- March 9, 2009: stocks bottom, 56.8% below the peak.
How the crisis built
The crisis began in the US housing market. Years of easy lending, including to borrowers with weak credit, had been packaged into complex securities held by banks and investors worldwide. As house prices fell and defaults rose from 2006 and 2007, the value of those securities became uncertain, and banks stopped trusting each other’s balance sheets. Funding markets seized up, and institutions that relied on short-term borrowing found themselves unable to roll over their debts. The failure of Lehman Brothers in September 2008 turned a slow-burning credit problem into a global panic.
How each asset behaved
Stocks: fell about 48% from August 2008 to March 2009 alone, much of the decline compressed into a few months.
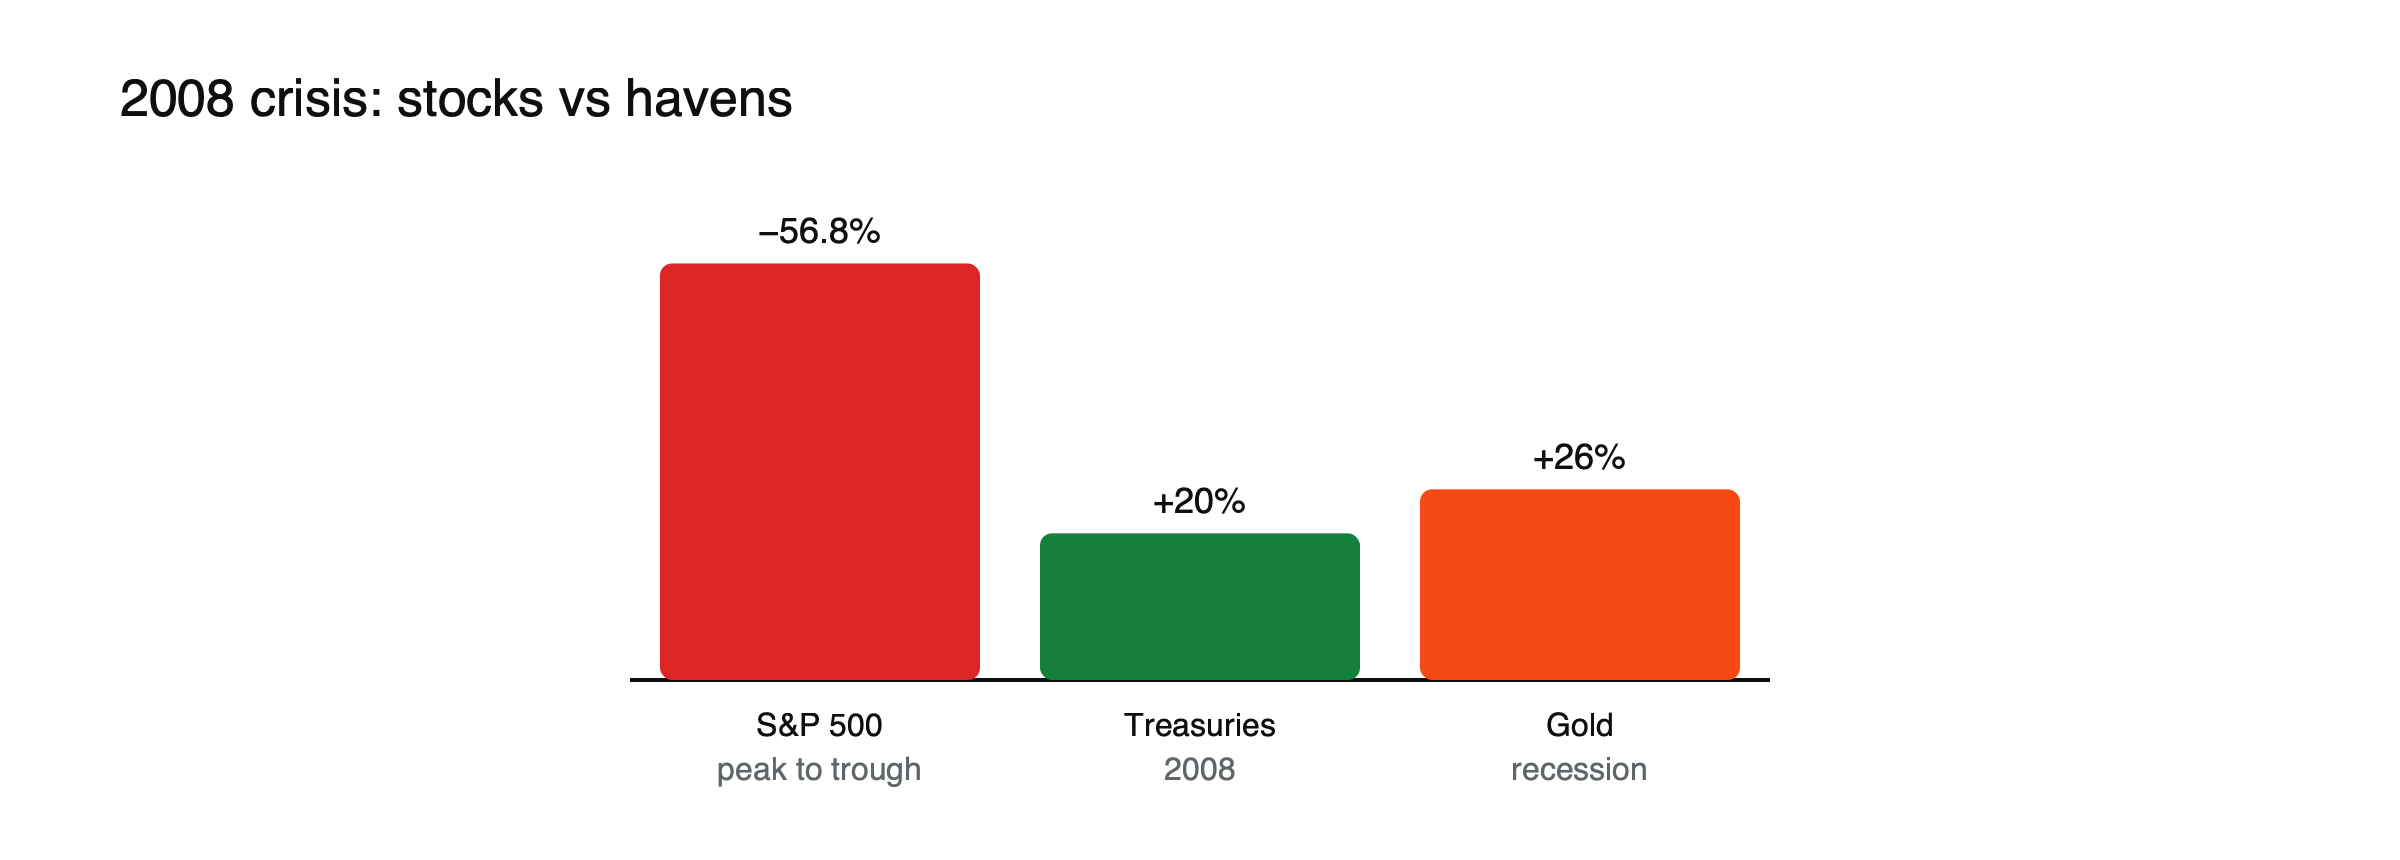
Figure: Stocks vs havens in the 2008 crisis. Sources: Atlanta Fed; Voronoi; Mining.com.
Government bonds: the classic hedge worked; Treasuries rallied as investors sought safety and rates were cut.
Gold: gained about 26% over the recession, though gold mining shares fell.
Credit: corporate bond spreads blew out as defaults loomed.
Correlations: many risky assets moved together, reducing the benefit of diversifying among them.
Oil: after peaking above $140 a barrel in early July 2008, crude collapsed to about $32 by December as demand evaporated, one of the largest falls in its history.
The dollar: strengthened in late 2008 as investors and banks worldwide scrambled for dollar funding, despite the crisis originating in the United States.
The policy response
Governments and central banks responded on an unprecedented scale. The Federal Reserve cut its policy rate to near zero by December 2008 and began buying large amounts of bonds, the first round of quantitative easing. The US government injected capital into banks and guaranteed money market funds, and central banks opened dollar swap lines to supply dollars abroad. These measures did not stop the fall immediately, but they laid the groundwork for the recovery that began in March 2009. See the history of quantitative easing.
Lessons
- Diversification across risky assets fails in a crisis; high-quality government bonds did the hedging.
- Credit markets gave early warning. See what credit spreads tell equity traders.
- The best returns came soon after spreads peaked.
See why correlations go to one in a crisis and how bear markets end.
Peak to trough at a glance
| Asset | Behavior through the crisis |
|---|---|
| S&P 500 | −56.8% from October 2007 to March 2009 |
| US Treasuries | About +20% in 2008 |
| Gold | About +26% over the recession |
| High-yield spreads | Peaked near 22% in December 2008 |
| Oil (WTI) | From above $140 in July to about $32 in December 2008 |
| VIX | Intraday high of 89.53 in October 2008 |
A portfolio through the crisis, illustrated
Suppose an investor held 60% shares and 40% Treasuries in September 2007. (Illustrative scenario.) If shares fell about 50% and Treasuries rose about 15% over the worst stretch, the portfolio would have lost roughly 24% rather than 50%. A portfolio of shares, corporate bonds and commodities, by contrast, would have lost far more, because all three fell together. The crisis showed which assets truly diversified equity risk.
What came after
From the March 2009 low, shares began one of the longest bull markets in history, helped by near-zero rates and repeated rounds of bond buying. Investors who sold near the bottom and stayed out missed much of the recovery, while those who held or rebalanced into shares benefited. See how bear markets end.
Lessons for CFD traders
Leveraged positions faced extreme risks: daily moves over 1% became routine, gaps were common and margin requirements rose. Traders who kept leverage low and used guaranteed stops, where offered, were far better placed than those relying on normal stop-losses in markets that jumped past them.
Banks and financial shares
Financial shares were at the center of the crash. Several major institutions failed or were rescued, and bank share prices fell far more than the broader market as investors feared losses on mortgage securities and loans. Governments injected capital into banks and arranged mergers to prevent further collapses. Financial shares took years to recover, and some never regained their pre-crisis levels.
Money market funds
In September 2008, a large US money market fund fell below $1 a share because of losses on Lehman Brothers debt, an event known as breaking the buck. Investors rushed to withdraw from similar funds, threatening short-term funding for companies, until the US government guaranteed money market funds. The episode showed that even supposedly cash-like products can carry risk in a crisis.
A global crisis
The crisis spread far beyond the United States. European banks held large amounts of US mortgage securities and faced their own funding problems, Iceland’s banking system collapsed and emerging markets suffered as capital fled. Share markets around the world fell together, showing how integrated global finance had become.
Currencies
As carry trades unwound, the Japanese yen rose sharply, while currencies of countries relying on foreign capital fell. The US dollar strengthened as investors sought safety and dollar funding, despite the crisis starting in the United States. See why the yen rallies when global markets sell off.
Common misreadings
- Believing all diversified portfolios fell equally.
- Assuming the recovery came only after the economy improved.
Housing, the starting point
US house prices, which had risen strongly through the early 2000s, began falling in 2006. Mortgage defaults rose, especially among borrowers with weak credit and adjustable rates, and the value of securities built from those mortgages collapsed. Housing construction slumped, and falling home values hit household spending, deepening the recession.
The long road back
Although shares bottomed in March 2009, the S&P 500 took several years to regain its 2007 peak, and the US economy recovered slowly, with unemployment remaining high for years. Central banks kept rates near zero and continued bond buying for an extended period. The slow recovery shaped investor behavior for a decade, encouraging the search for yield that later fueled booms in other assets. See the history of quantitative easing.
Early warning signs
Many signals flashed before the worst of the crisis. Credit spreads began widening in mid-2007, funding markets came under strain in August 2007 and the investment bank Bear Stearns was rescued in March 2008, six months before Lehman’s failure. Shares had already fallen significantly by then. Investors who watched credit markets and funding stress had time to reduce risk, though few foresaw the full scale of what followed. See which cross-asset signals tend to lead stocks.
What 2008 means today
Banks hold more capital and are more tightly regulated than before 2008, and central banks have tools ready to support markets quickly. But risks have moved to other parts of the financial system, such as funds using leverage, and a crisis could start somewhere new. The lasting lessons are about leverage, liquidity and the value of genuinely diversifying assets, rather than any specific repeat of 2008.
Volatility through the crisis
The VIX reached an intraday high of 89.53 in October 2008, reflecting extreme uncertainty, and stayed elevated for months. In September and October, 34 of 42 trading days saw share moves of more than 1%, making normal risk management difficult. Such sustained volatility forced many leveraged investors to cut positions repeatedly, adding to the selling pressure. When volatility finally began to fall in early 2009, it signaled that the worst of the forced selling was over, shortly before shares bottomed in March. Watching the VIX alongside credit spreads gave a much clearer picture of when panic was finally starting to ease.
Frequently asked questions
Did gold rise throughout the crisis?
No. It fell during parts of the panic in late 2008 as investors raised cash, but ended the recession well above its starting level.
Which assets fell least?
High-quality government bonds, especially US Treasuries, which rose as rates were cut and investors sought safety.
This article is educational content and does not constitute financial, investment, legal or tax advice. Digital assets are volatile and you may lose the amount you invest.
Sources
- Stock Prices in the Financial Crisis (S&P 500 −56.8% from October 9, 2007 to March 9, 2009; −48% from August 28, 2008) — Federal Reserve Bank of Atlanta
- Stock-Bond Return Correlation Flips Positive (2008: bonds +20.1%, stocks −37.0%) — Voronoi
- Will next market crash be like 2008 or 1973? (S&P 500 −57% vs gold +26% in the 2007–2009 recession) — Mining.com
- Revisiting the Fall of 2008 (34 of 42 days with moves over 1%; long Treasuries nearly +15% in November) — A Wealth of Common Sense
- Why do credit spreads widen in recessions? (HY spread peak 21.82% in December 2008) — Eco3min
- VIX peak near 89 in October 2008 — Early Retirement forum data summary
- Oil price swings (WTI above $140 a barrel in early July 2008, falling to $32.40 in December 2008) — Oxford Institute for Energy Studies, Oxford Energy Forum, November 2009
- The fear gauge: what the VIX tells us (record close 82.69 on March 16, 2020; 89.53 intraday in October 2008) — Datahub