
How the 2020 Pandemic Crash Hit Every Asset Class
In February and March 2020 stocks fell 34% in 23 trading days, oil went negative, gold and bonds wobbled and bitcoin halved in a day. A cross-asset timeline.

The 2020 pandemic crash was the fastest bear market on record: the S&P 500 fell about 34% from February 19 to March 23, 2020, in 23 trading days. In the worst days, almost every asset was sold for cash. Treasuries swung wildly, gold briefly fell, bitcoin dropped about 50% in a day, and in April US oil futures turned negative.
Timeline
- February 19: the S&P 500 hits a record high.
- March 9: oil falls more than 20% as a Saudi-Russian price war erupts; the 30-year Treasury yield drops to a record low; stocks have their worst day since 2008.
- March 9–16: gold, at a seven-year high, gives back nearly 15% over five sessions.
- March 12: bitcoin falls about 50% in a day; a major bond ETF trades 6.2% below its asset value.
- March 16: the S&P 500 falls about 12%, one of its largest one-day drops on record.
- March 23: stocks bottom as the Fed announces unlimited asset purchases.
- April 20: US oil futures settle below zero.
- August: the S&P 500 regains its pre-crash high.
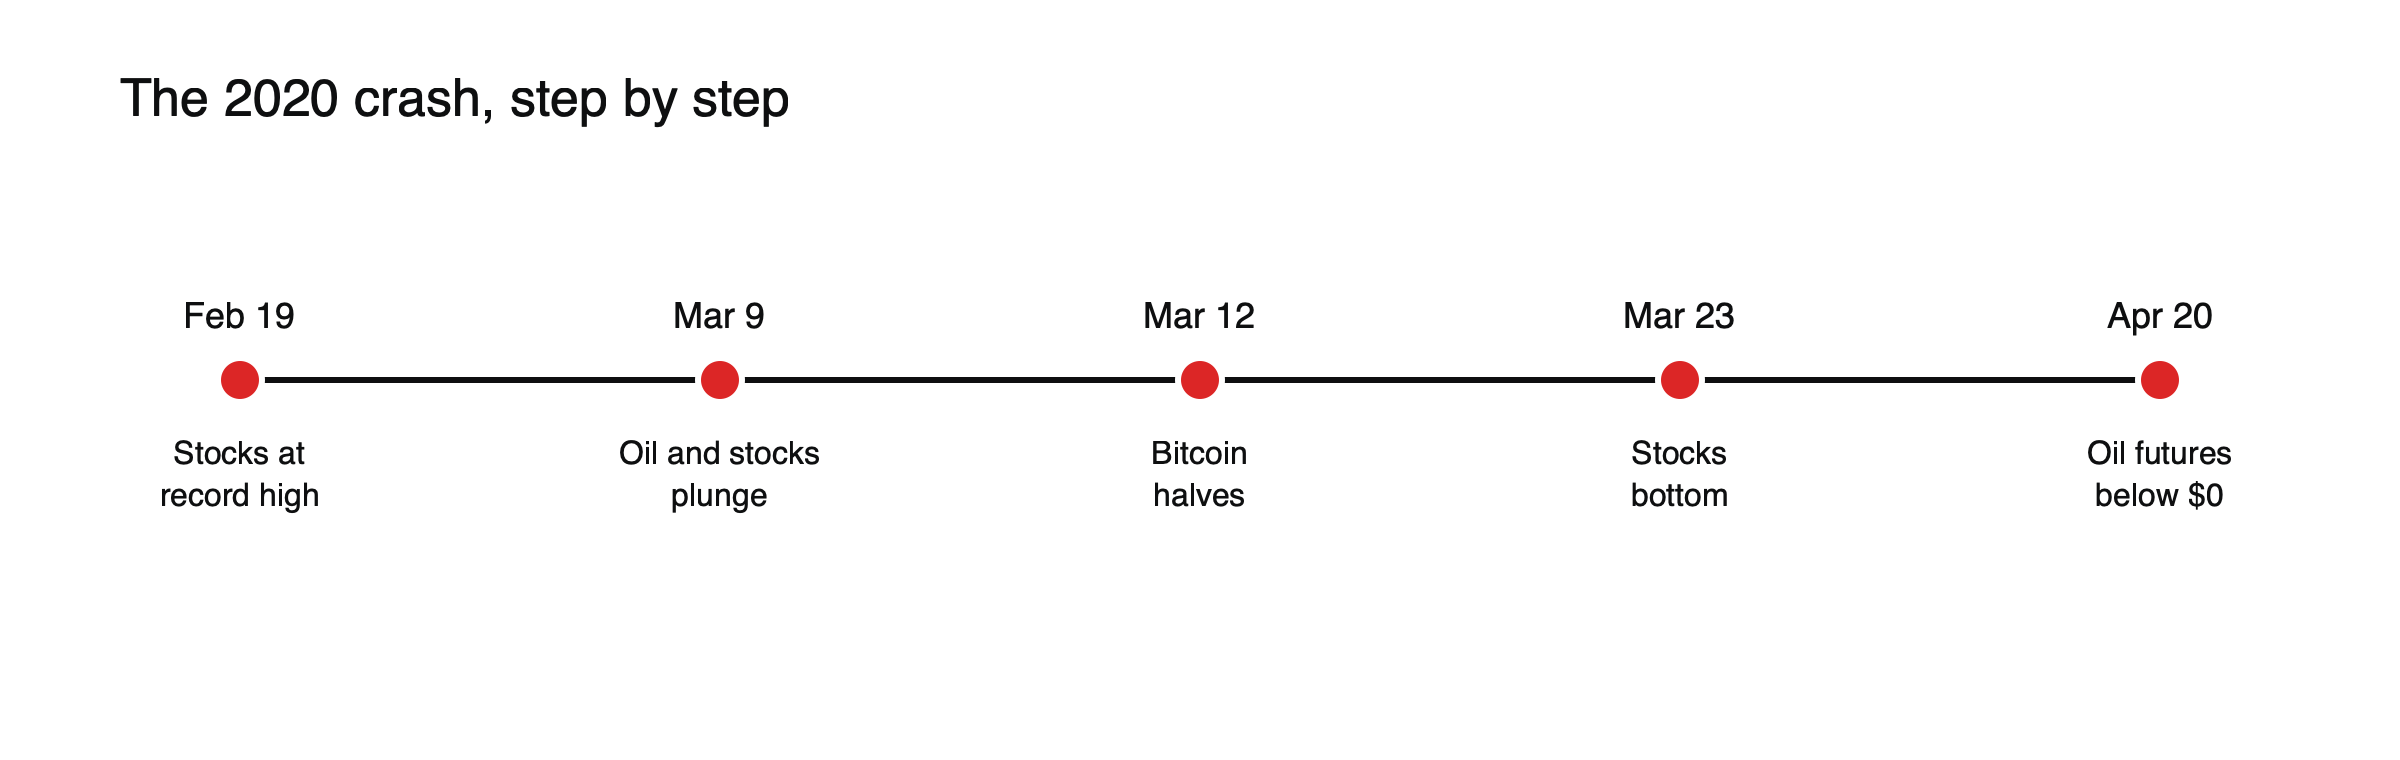
Figure: Two months that hit every asset class.
Why it was so fast
The pandemic hit the economy almost overnight, as lockdowns shut businesses worldwide. Markets that had been near record highs had to reprice the risk of a deep recession in days. Leverage, crowded positions and automated selling amplified the fall, and in mid-March a dash for cash hit even the safest markets. The speed set it apart from 2008, when the decline unfolded over 17 months. See what happened across markets in 2008.
How each asset behaved
Stocks: sharpest fall in decades, then one of the fastest recoveries.
Treasuries: yields first hit record lows, then briefly jumped as investors sold even safe assets for cash.
Gold: fell in the dash for cash, then rose with stimulus.
Bitcoin: sold off with everything else, then rose sharply in the months after.
Oil: collapsed as demand vanished and storage filled.
Volatility: the VIX closed at a record 82.69 on March 16, above even its 2008 closing peak.
Credit: US high-yield spreads rose to about 1,087 basis points on March 23, pricing widespread defaults, before narrowing quickly as central banks intervened.
Oil below zero
On April 20, 2020, the May WTI futures contract fell from about $17.73 to settle at −$37.63 a barrel, the first negative price in its history, as storage filled and holders of expiring contracts had to pay to avoid taking delivery. The episode showed how futures-based products can behave in ways the underlying physical market does not suggest. See why oil went negative in 2020.
The policy response
Central banks and governments acted on a scale beyond 2008 within weeks. The Federal Reserve cut rates to near zero, offered unlimited bond purchases and launched programs to support corporate bonds, while governments approved huge fiscal packages. The speed of the response helped markets bottom on March 23 and recover much faster than after 2008.
Lessons
- In a liquidity panic, even havens can fall briefly. See why correlations go to one in a crisis and, for comparison, what happened across markets in 2008.
- Central bank action can end a crash quickly.
- Holding cash before a crisis gives options. See what happened in the May 2021 crypto crash for a crypto-specific example.
At a glance
| Asset | Worst point | Recovery |
|---|---|---|
| S&P 500 | −34% by March 23 | New high by August |
| VIX | Record close 82.69 on March 16 | Fell steadily after |
| High-yield spreads | About 1,087 bp on March 23 | Narrowed rapidly |
| Gold | About −15% in five sessions | Record highs later in 2020 |
| Bitcoin | About −50% in a day | Strong rally in late 2020 |
| WTI crude | −$37.63 on April 20 | Recovered as demand returned |
A portfolio through the crash, illustrated
Suppose an investor held 60% shares, 30% long Treasuries and 10% gold on February 19. (Illustrative scenario.) By mid-March, shares were down about 30%, while Treasuries were up modestly and gold was roughly flat after its sell-off, leaving the portfolio down roughly 17%. By August, shares had recovered, and Treasuries and gold had gained, leaving the portfolio ahead. The crash was severe but brief for diversified investors who did not sell.
What made 2020 different from 2008
The 2020 shock came from outside the financial system, banks were better capitalized and policy responses came within weeks rather than months. The economy suffered a deep but short recession, and markets looked through it quickly. The key lesson was that speed of policy response can shorten a crisis dramatically.
Lessons for CFD traders
Spreads widened, gaps were frequent and some markets saw limit moves and trading halts. Margin requirements rose sharply. Traders with high leverage faced stop-outs at the worst prices, while those with low leverage and some cash could take advantage of the recovery. See what stock market circuit breakers are.
Treasuries under strain
In mid-March 2020, even the US Treasury market, the deepest in the world, came under strain. Foreign central banks, funds and other investors sold Treasuries to raise dollars, and dealers struggled to absorb the selling. Yields jumped and prices swung wildly, until the Federal Reserve began buying Treasuries in huge amounts. The episode showed that the safest asset can behave erratically when everyone needs cash at once.
Winners and losers among sectors
Airlines, cruise lines, hotels and energy companies collapsed as travel and demand stopped, while technology, online retail and healthcare companies recovered quickly and many reached new highs within months. The crash accelerated trends such as remote work and online shopping, reshaping market leadership. See market leadership by decade.
The dollar
The dollar jumped in March as investors and borrowers worldwide scrambled for dollars, then weakened through the rest of 2020 as the Federal Reserve flooded markets with liquidity and opened swap lines with other central banks.
A new generation of traders
Lockdowns, stimulus payments and commission-free trading apps drew millions of new retail traders into markets in 2020. Their buying contributed to the rapid recovery in some shares. See the retail trading boom.
Common misreadings
- Treating March 2020 as proof that havens never work.
- Assuming every crash will recover as quickly.
The policy toolkit, expanded
Many tools first used in 2008 were deployed faster and on a larger scale in 2020: near-zero rates, large bond purchases, dollar swap lines and support for money market funds. New programs went further, including central bank support for corporate bonds and loans to businesses. The scale of support helped markets recover quickly but also contributed to the inflation that followed in 2021 and 2022, setting up the very different market environment described in what 2022 taught investors about diversification.
Lessons for investors
The crash showed that diversified investors who stayed invested recovered quickly, while those who sold near the bottom locked in losses. It also showed the value of holding some cash, both to avoid forced selling and to take advantage of falling prices.
Warning signs, or the lack of them
Unlike 2008, the 2020 crash gave little warning in financial markets. Credit spreads were tight and shares were near record highs in mid-February. The trigger came from outside finance, and markets repriced it in days. The lesson is that some shocks cannot be anticipated by watching markets, which is why keeping leverage moderate and liquidity available matters at all times.
What 2020 means today
The speed of both the crash and the recovery has shaped how investors react to sudden shocks. Many now expect fast policy support, which can encourage buying during sell-offs. That expectation may hold, but central banks facing high inflation could be slower to respond, so relying on a 2020-style rescue carries its own risk.
How the crash compared with others
The 2020 fall of about 34% was smaller than 2008’s decline of nearly 57%, but it happened in 23 trading days rather than 17 months. Its recovery, about five months to a new high, was also much faster than after 2008, when it took years. Speed in both directions is now one of the defining features of modern market crises, driven by faster information flows, automated trading and quicker policy responses. Investors need to plan for crises that unfold in days, not months, and for recoveries that can be abrupt.
Frequently asked questions
Why did gold fall during the crash?
Investors sold liquid assets, including gold, to raise cash and meet margin calls. It recovered quickly once central banks acted.
How long did the recovery take?
The S&P 500 regained its February high by August 2020, about five months after the bottom.
This article is educational content and does not constitute financial, investment, legal or tax advice. Digital assets are volatile and you may lose the amount you invest.
Sources
- COVID-19 Market Crash 2020 (S&P 500 −34% in 23 trading days; bottom on March 23 with unlimited QE; recovered by August) — Fin Still
- March Market Madness (record-low yields; March 16 drop of 12%; yields jumped in the dash for cash) — ETF.com
- March 2020 review (gold gave back nearly 15% over five sessions from its March 9 high) — Nasdaq
- US stocks see worst day since 2008 with crude in free fall (March 9, 2020) — BNN Bloomberg
- 14 weeks and 12 numbers (bond ETF 6.2% below NAV on March 12; oil below $0 on April 20) — Monevator
- Key financial events of 2020 (bitcoin down 50% in a single day) — Myth of Money
- The fear gauge: what the VIX tells us (record close 82.69 on March 16, 2020; 89.53 intraday in October 2008) — Datahub
- Bond credit spread (US high-yield OAS 1,087 bp on March 23, 2020) — BIT Knowledge Hub
- CFTC staff interim report on NYMEX WTI trading around April 20, 2020 (May contract fell from $17.73 to settle at −$37.63; first negative price in 37 years) — CFTC