
What the Copper-Gold Ratio Says About Growth Expectations
The copper-gold ratio compares an industrial metal with a safe haven to gauge growth expectations. How it tracked yields, why it broke down, how to use it.
The copper-gold ratio is the price of copper divided by the price of gold. Copper is an industrial metal whose demand rises with economic activity; gold is a safe haven. A rising ratio has signaled optimism about growth, a falling one caution. For years it tracked the 10-year US Treasury yield closely, but since 2024 the two have diverged sharply.
How the ratio is calculated, illustrated
Copper is usually quoted in dollars per pound or per tonne, and gold in dollars per ounce, so the ratio’s level depends on the units used; what matters is its direction. Suppose copper rises 10% while gold is unchanged: the ratio rises 10%, signaling stronger growth expectations. If copper is flat and gold rises 20%, the ratio falls about 17%, signaling caution, even though nothing has happened to industrial demand. (Illustrative figures.) Checking which metal moved is the first step in reading the ratio.
Why it was useful
Copper goes into wiring, motors and power grids, so its price reflects industrial demand. Gold rises when investors seek safety. The ratio therefore captured the balance between growth hopes and fear, and it historically rose and fell with long-term bond yields, which also reflect growth and inflation expectations.
How it was used. Investor Jeffrey Gundlach popularized the link in 2018, treating the ratio as a guide to where the 10-year yield “should” be. In 2022 and 2023, when yields rose while the ratio fell, he argued the ratio signaled that yields should be lower.
Why it broke down
- Gold’s new buyer: central banks bought about 1,000 tonnes of gold a year from 2022 to 2024, about double the previous decade’s pace, lifting gold for reasons unrelated to growth fears.
- Copper’s own story: mine supply limits and electrification demand changed copper’s drivers.
- Yields’ own story: higher deficits and inflation kept long-term yields up.
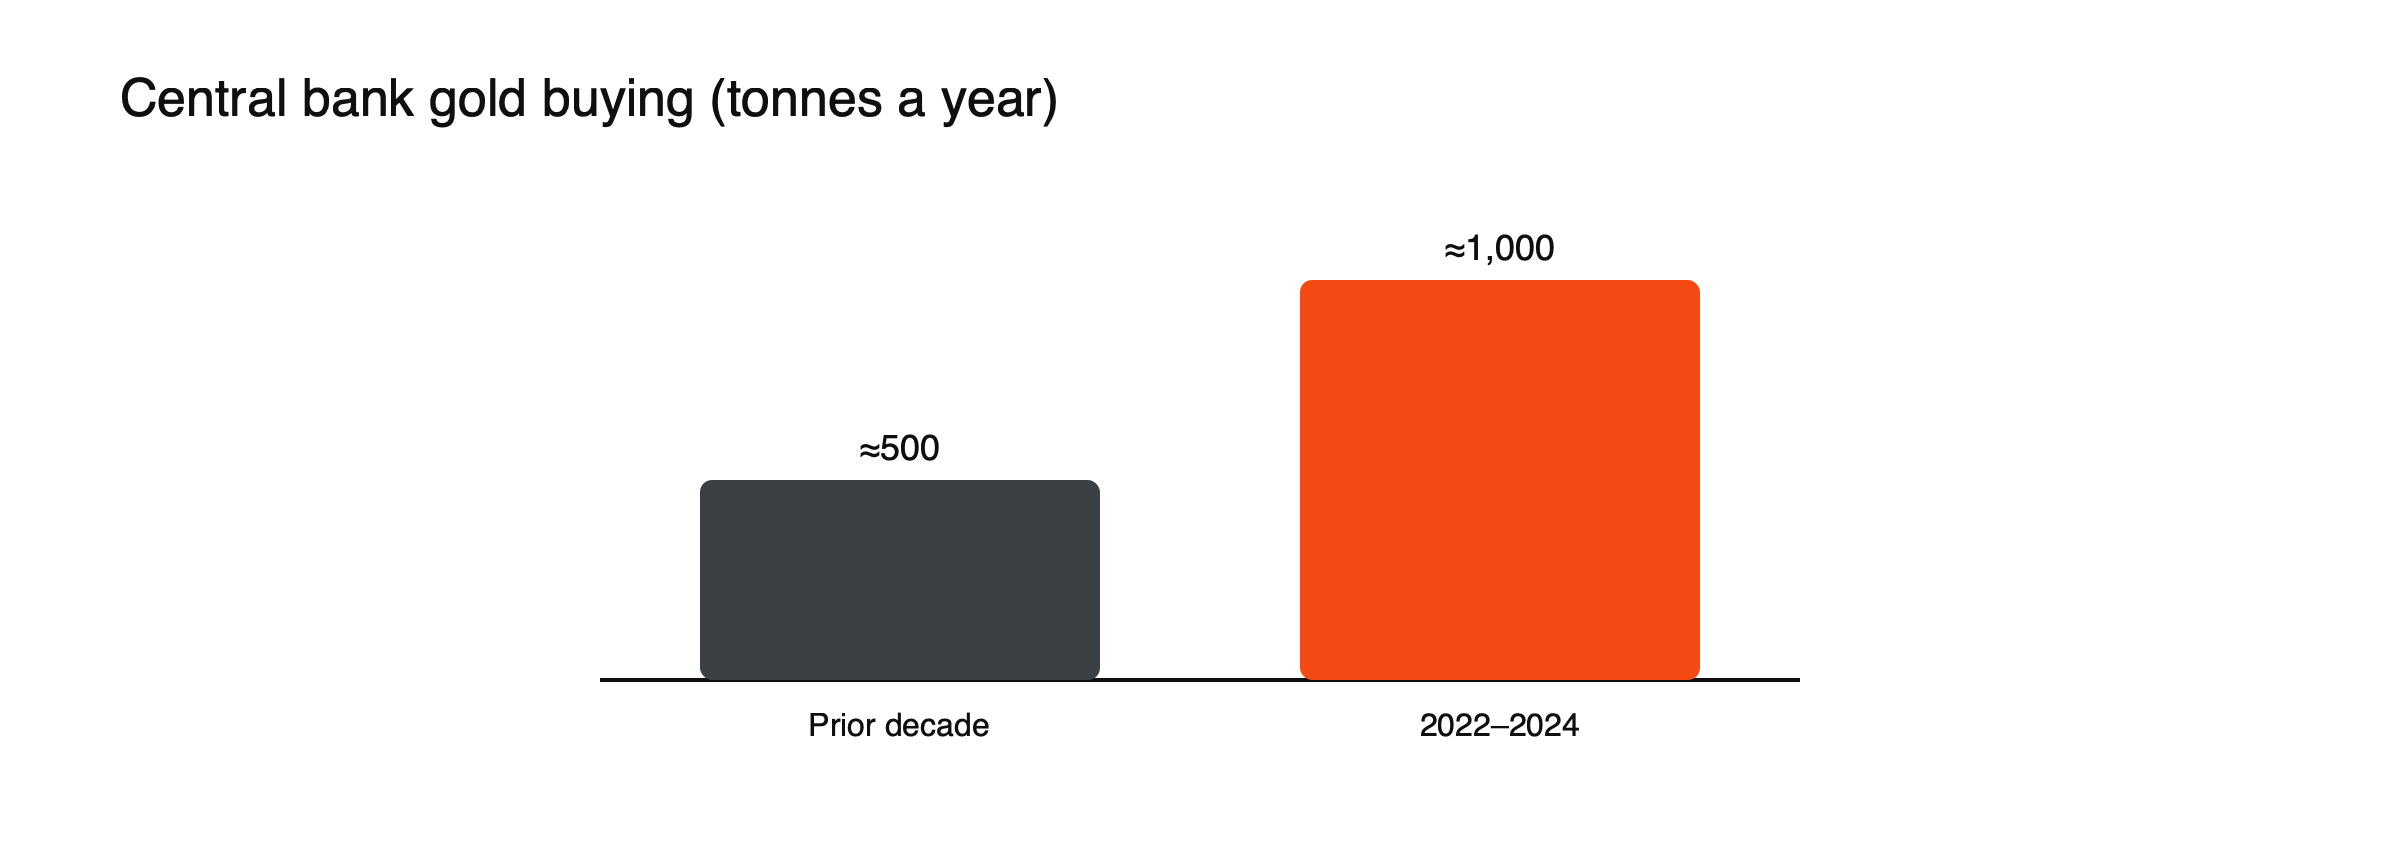
Figure: Central bank demand changed gold’s drivers. Source: Janus Henderson.
Gundlach later called the ratio’s use for forecasting the 10-year yield a failure and said he now preferred oil prices and the dollar.
Copper’s new story
Copper has become central to electrification: power grids, electric vehicles, renewable energy and data centers all use large amounts. With mine supply struggling to keep up, copper reached a record of about $14,624.50 a tonne on the London Metal Exchange in 2026. Those structural forces mean copper’s price reflects long-term supply and demand trends, not just the business cycle, which weakens its role as a pure growth gauge. See what moves copper prices.
How to use it now
Treat the ratio as one view of growth sentiment, and check what is moving it: a falling ratio driven by central bank gold buying says less about growth than one driven by falling copper demand. See which cross-asset signals tend to lead stocks how real yields connect gold, growth stocks and crypto and why correlations go to one in a crisis.
Alternatives to the ratio
Traders looking for growth signals now use a wider set of indicators: purchasing managers’ indices, the yield curve, credit spreads, cyclical versus defensive share performance and industrial commodity indices. No single indicator captures growth expectations reliably, and combining several reduces the risk of one being distorted by its own story. See which cross-asset signals tend to lead stocks.
When the ratio still helps
The ratio remains useful when both metals are moving for cyclical reasons: in a global recession scare, copper usually falls and gold rises, sending the ratio down sharply; in a strong recovery, the reverse. In such periods, it still captures the balance between growth hopes and fear quickly and clearly.
A reading routine
- Check which metal moved and why.
- Compare the ratio’s direction with bond yields and share indices.
- Look for central bank gold buying or copper supply news that could distort it.
- Treat sharp moves as prompts to check other indicators, not as signals on their own.
Copper and China
China consumes about half of the world’s copper, so Chinese construction, infrastructure and manufacturing heavily influence its price. A Chinese property slowdown can weigh on copper even when the rest of the world is growing, while Chinese stimulus can lift it sharply. That makes the ratio partly a gauge of Chinese demand rather than global growth. See how China’s policy moves ripple into commodities.
Gold’s drivers today
Gold responds to real yields, the dollar, central bank buying, geopolitical tension and investor flows into gold funds. Several of these have little to do with economic growth. When central banks buy heavily, or geopolitical fear rises, gold can climb while growth expectations are steady, pushing the ratio down for reasons that have nothing to do with copper or the economy.
The ratio and share markets
A rising ratio has often coincided with cyclical sectors, such as industrials, materials and banks, outperforming defensive ones, because both reflect improving growth expectations. A falling ratio has often matched defensive leadership. The link is looser than it once was, but the ratio can still help confirm what sector rotation is signaling. See what sector rotation is.
Trading the ratio
Some traders express a view on the ratio directly by buying copper and selling gold through CFDs, or the reverse, sizing each leg to similar exposure. Such trades profit from relative moves, not from the direction of metals in general, but they carry the full volatility of both metals and the costs of two positions.
Common misreadings
- Reading every fall in the ratio as a recession signal.
- Using the ratio to forecast bond yields precisely.
A recession scare, illustrated
Suppose weak manufacturing data from China and the United States arrive in the same week. (Illustrative scenario.) Copper falls 8% on fears of weaker demand, while gold rises 4% as investors seek safety. The ratio drops about 12%, 10-year Treasury yields fall and cyclical shares underperform. In this case, all the signals agree, and the ratio is doing exactly what it was traditionally used for: capturing a swing from growth optimism to caution.
Copper, gold and inflation
Both metals can rise with inflation, copper because of strong demand and supply constraints, gold as a store of value. In inflationary periods, the ratio can therefore move sideways even as both prices climb, hiding the strength of the inflation story. Looking at each metal’s price, not only the ratio, avoids missing that.
Using long-term charts
Over decades, the ratio has drifted as the structure of both markets changed, so comparing today’s level with a reading from twenty years ago says little. Its direction over months, and how quickly it moves, carries more information than its level.
What could restore the link
If central bank gold buying slows and copper’s supply story stabilizes, the ratio could again track growth expectations and bond yields more closely. Until then, it is best read alongside the forces distorting it, rather than on its own.
Other metal ratios
Some analysts use similar ratios, such as copper to silver or industrial metals indices to gold, to cross-check growth signals. Silver has both industrial and precious-metal uses, so ratios involving it blend both stories. Using several ratios helps spot when one is being distorted by a single market’s supply or demand quirks.
A watchlist for the ratio
- Copper and gold prices separately
- Chinese industrial data and stimulus news
- Central bank gold purchases
- 10-year Treasury yields
- Cyclical versus defensive share performance
- Gold fund flows and geopolitical news
Checking these together shows whether the ratio is telling a growth story or reflecting one metal’s own drivers. Reviewing the list once a week takes only a few minutes and keeps the ratio’s message in its proper context.
Frequently asked questions
Is the copper-gold ratio still worth watching?
Yes, as one view of growth sentiment, but not as a precise guide to bond yields.
Why did gold rise even as yields stayed high?
Heavy buying by central banks and safe-haven demand lifted gold for reasons unrelated to growth expectations.
This article is educational content and does not constitute financial, investment, legal or tax advice. Digital assets are volatile and you may lose the amount you invest.
Sources
- The Copper-Gold Ratio as a Macro Signal (tracked the 10-year yield; divergence since 2024; Gundlach 2018 and later view) — Eco3min
- Is the Copper–Gold Ratio a Dependable Leading Indicator on Rates? (Gundlach comments in 2022–2023) — CFA Institute Enterprising Investor, March 2023
- Copper, Gold and Treasurys in a new world (central bank gold buying; deficits and inflation) — ETF Trends, June 2024
- What’s behind the divergence between gold and real yields (central banks about 1,000 tonnes a year 2022–2024 vs about 500 before) — Janus Henderson
- [Copper hits record amid weak output (LME record $14,624.50 a tonne; grids, electrification and data centers) — Saxo, September 2026](https://www.home.saxo/de-ch/content/articles/commodities/copper-hits-record-amid-weak-output-and-metal-pil