
What Credit Spreads Tell Equity Traders
Credit spreads measure the extra yield on corporate bonds over Treasuries. Why widening spreads have often warned of stock market stress, and how to read them.
Credit spreads are the extra yield investors demand to hold corporate bonds instead of government bonds. When spreads widen, bond investors expect more defaults and less liquidity, and stocks have often struggled afterward. The US high-yield spread peaked near 22% in December 2008 and around 11% in March 2020, both during deep equity sell-offs.
How spreads work
Credit spread = corporate bond yield − government bond yield of the same maturity.
High-yield, or “junk,” bonds pay the widest spreads because their issuers are riskier. In healthy markets, high-yield spreads have typically run around 3% to 4%.
Why equity traders watch them
Credit investors are paid back first, so they are often quick to price in trouble. Spreads also reflect funding conditions: when they widen, companies pay more to borrow, which can squeeze profits.
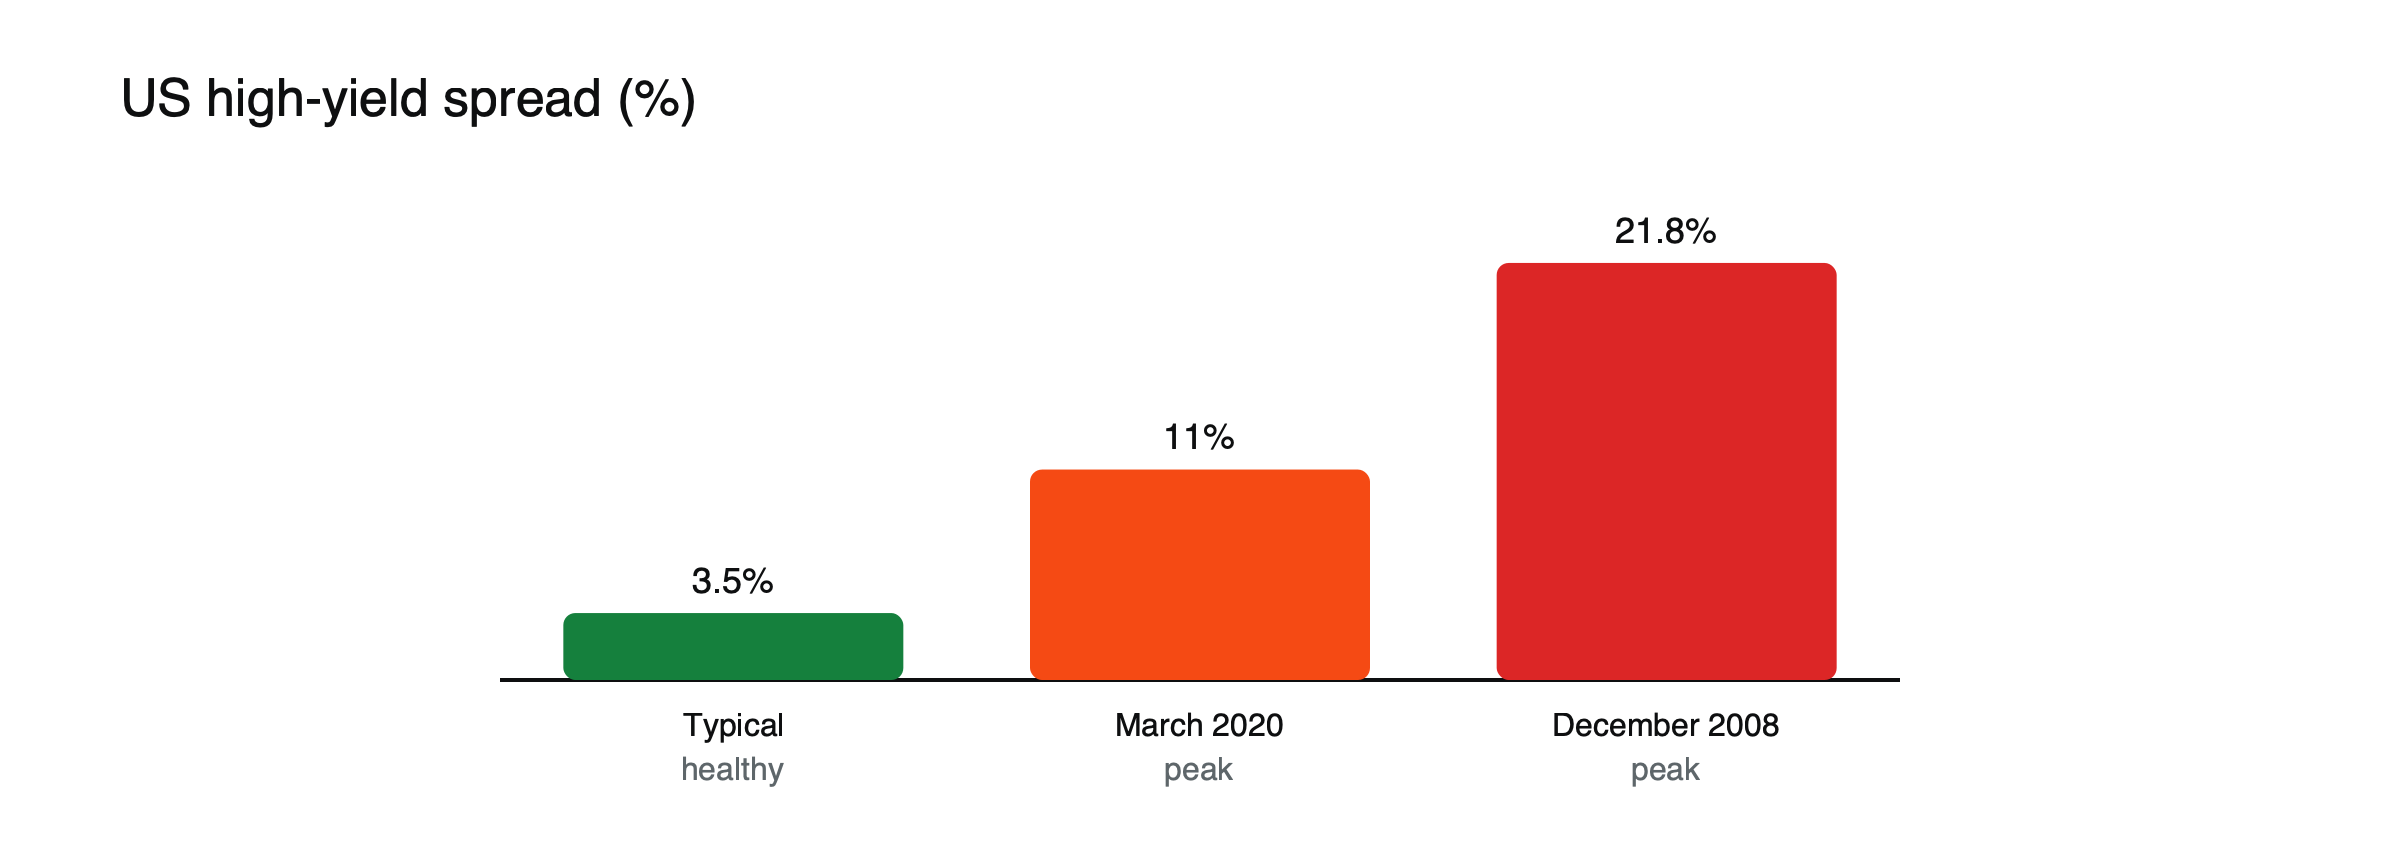
Figure: High-yield spread levels. Source: FRED data via Eco3min; typical range from StockAlarm.
- Before 2008: the high-yield spread widened as early as mid-2007, well before the worst of the stock crash.
- 2020: spreads rose from about 3.5% to about 11% in three weeks.
- Recessions: high-yield spreads have widened before every US recession since 1996 in one dataset, typically three to nine months earlier.
A warning sign, illustrated
Suppose high-yield spreads, quiet at 3.2% for months, widen to 4.5% over six weeks while the S&P 500 is still near its highs. (Illustrative scenario.) Bond investors are demanding more compensation for lending to weaker companies, perhaps because of rising defaults in one sector or tightening bank credit. Stocks have not reacted yet. In past cycles, such divergences have often been resolved by stocks catching down to credit rather than spreads recovering, though not always.
Why credit often moves first
Bond investors focus on the downside: their maximum return is fixed, so they care mainly about whether they will be repaid. Equity investors focus on growth and can stay optimistic longer. Credit markets are also dominated by institutions that analyze balance sheets closely. These differences help explain why spreads often react to deteriorating conditions before share prices do.
What happens after peaks
Some of the best stock returns have come after spreads peak and start falling. When high-yield spreads fell from about 11% in March 2020 to about 6% by mid-2020, the S&P 500 rose roughly 20% in the second quarter.
2008 and 2020 compared
High-yield spreads peaked at about 21.8% in December 2008, after months of widening that began well before the worst of the stock crash, and at about 11% in March 2020, after an extraordinarily fast jump from about 3.5% in three weeks. In 2008, the widening was gradual and gave long warning; in 2020, it was sudden and the reversal equally fast, as central banks intervened. The speed of the widening said a lot about the nature of each crisis.
Limits
- Spreads can stay tight for a long time; tight spreads can reflect complacency.
- Sector problems, such as energy in 2015–16, can widen spreads without a broad recession.
- Central bank bond buying can compress spreads quickly.
For related signals, see which cross-asset signals tend to lead stocks , why correlations go to one in a crisis and when bonds rally but stocks don’t.
Investment grade versus high yield
High-yield spreads are the most sensitive gauge, but investment-grade spreads matter too. When even strong companies’ spreads widen sharply, stress has spread beyond weaker borrowers, which is usually a more serious sign. Watching both shows how broad the stress is. See investment-grade vs high-yield bonds.
Sector signals
Spreads in particular sectors, such as energy, banks or property, can flag trouble before it shows in sector share prices. In 2015 and 2016, energy-sector spreads widened sharply as oil prices collapsed, warning of the defaults that followed among smaller producers.
Using spreads in practice
Equity traders often keep a chart of high-yield spreads next to their main index. Widening spreads argue for caution and smaller positions; spreads peaking and starting to fall after a crisis have often been followed by strong equity rallies. Neither signal is precise, but together with other indicators they help frame risk. See what a credit spread is.
A simple rule of thumb, illustrated
Some traders use a basic rule: reduce equity exposure when high-yield spreads have widened more than one percentage point from their recent low, and increase it again when spreads have peaked and fallen back by a similar amount. (Illustrative rule, not a recommendation.) Such a rule would have reduced exposure in 2007 and early 2020 and increased it during the recoveries that followed, but it would also have produced false alarms, for example during the energy-driven widening of 2015 and 2016. Rules based on spreads work best as one input among several.
Spreads and earnings
Credit spreads and corporate earnings are closely linked. When profits fall, companies’ ability to service debt weakens and spreads widen. Analysts’ earnings revisions and spread moves often confirm each other; when they diverge, one market is usually about to catch up.
Spreads and bank shares
Bank shares are particularly sensitive to credit conditions, because banks lend to the same companies whose bonds are trading at wider spreads. Widening spreads often coincide with falling bank shares, and stress in bank funding markets can widen spreads across the economy.
Leverage and buybacks
Companies that borrowed heavily to fund buybacks or acquisitions are more exposed when spreads widen, because refinancing becomes expensive. Their shares can fall sharply when credit tightens, even if their businesses are stable.
Outside the United States
European and emerging market credit spreads follow the same logic and are watched for signs of regional stress. In Europe, widening spreads on bank and corporate bonds have often accompanied sovereign debt worries.
Common misreadings
- Treating one week of widening as a recession signal.
- Ignoring credit because it is not traded directly.
Reading spread levels
| US high-yield spread | Typical reading |
|---|---|
| Below 3% | Very tight: strong confidence, possible complacency |
| 3% to 4% | Normal in healthy markets |
| 5% to 7% | Stress building; growth worries |
| Above 8% | Severe stress or recession pricing |
| Above 10% | Crisis, as in 2008 and March 2020 |
(Rough ranges; the mix of issuers changes over time.)
Where spreads stood in 2026
In July 2026, US high-yield spreads were around 2.7 percentage points, near their tightest in years, reflecting strong demand for corporate debt and confidence in company finances. Such tight levels leave little cushion if conditions worsen, which is why some investors watch for even modest widening from these levels as an early warning.
Credit and equity volatility
Spreads and equity volatility tend to rise together. When the VIX jumps, high-yield spreads usually widen, and vice versa, because both reflect uncertainty about corporate prospects. A rise in the VIX without any widening in spreads may signal a shorter-lived equity scare; both rising together suggests broader stress. See what the VIX is.
Spreads around central bank turns
When a central bank shifts from raising rates to cutting them, spreads can move either way. If cuts come because inflation has fallen and growth is holding up, spreads often tighten further. If cuts come because the economy is weakening sharply, spreads tend to widen despite lower rates. Watching spreads around a policy turn helps show which kind of easing is under way.
A spread checklist
- Where are high-yield and investment-grade spreads relative to their recent range?
- Are they widening or tightening, and how fast?
- Is the move broad or concentrated in one sector?
- Are equity volatility and bank shares confirming the signal?
- What are central banks signaling about policy?
Spreads and the cost of capital
Wider spreads raise the cost of borrowing for companies, which can delay investment and hiring and reduce the value of future profits. For equity investors, that means wider spreads are not just a warning signal but a direct drag on corporate prospects, especially for smaller and more indebted firms. Their share prices often reflect this first.
Frequently asked questions
Where can I see credit spreads?
Central bank databases and many financial websites publish daily investment-grade and high-yield spread indices.
Do tight spreads mean stocks are safe?
Not necessarily. Tight spreads reflect confidence but can also signal complacency, and they can widen quickly.
This article is educational content and does not constitute financial, investment, legal or tax advice. Digital assets are volatile and you may lose the amount you invest.
Sources
- Why do credit spreads widen in recessions? (HY peaks of 21.82% in December 2008 and about 11% in March 2020; FRED data) — Eco3min
- What are credit spreads and why do they predict recessions? (widened before every US recession since 1996; 3–9 months lead) — Eco3min
- Credit Spreads: The Market’s Early Warning Indicators (widened from mid-2007) — Real Investment Advice
- The Only Market Indicator That Works (spreads from about 1,100 to 600 basis points in 2020; S&P 500 up about 20% in Q2) — Tim Melvin
- Credit Spreads (from 350 to 1,100 basis points in three weeks in March 2020) — Fin Still
- High Yield Credit Spread (healthy markets 300–400 basis points; energy 2015–16) — StockAlarm