
Why the Stock-Bond Correlation Flipped After 2021
For two decades bonds rose when stocks fell; in 2022 they fell together. How the stock-bond correlation turned positive and why inflation drove the change.
The stock-bond correlation flipped from negative to positive in 2022 because inflation replaced growth as markets’ main worry. For two decades, bonds tended to rise when stocks fell. As inflation surged and rates rose fast, both fell: the S&P 500 about 18% and US bonds about 13%, a 60/40 portfolio’s worst year since 1937.
Timeline
- About 1965–2000: with higher and more volatile inflation, the correlation was mostly positive.
- 1998–2021: inflation was low and stable; the correlation sat mostly between −0.30 and −0.50, and bonds hedged stocks reliably.
- 2008: bonds gained about 20% while stocks fell 37%, the classic hedge in action.
- 2022: inflation reached its highest since the early 1980s, the Fed raised rates at the fastest pace in decades, and the correlation rose to about +0.50. Stocks and bonds fell together for 14 straight months.
- 2026: the correlation was still positive, around +0.40 on one measure.
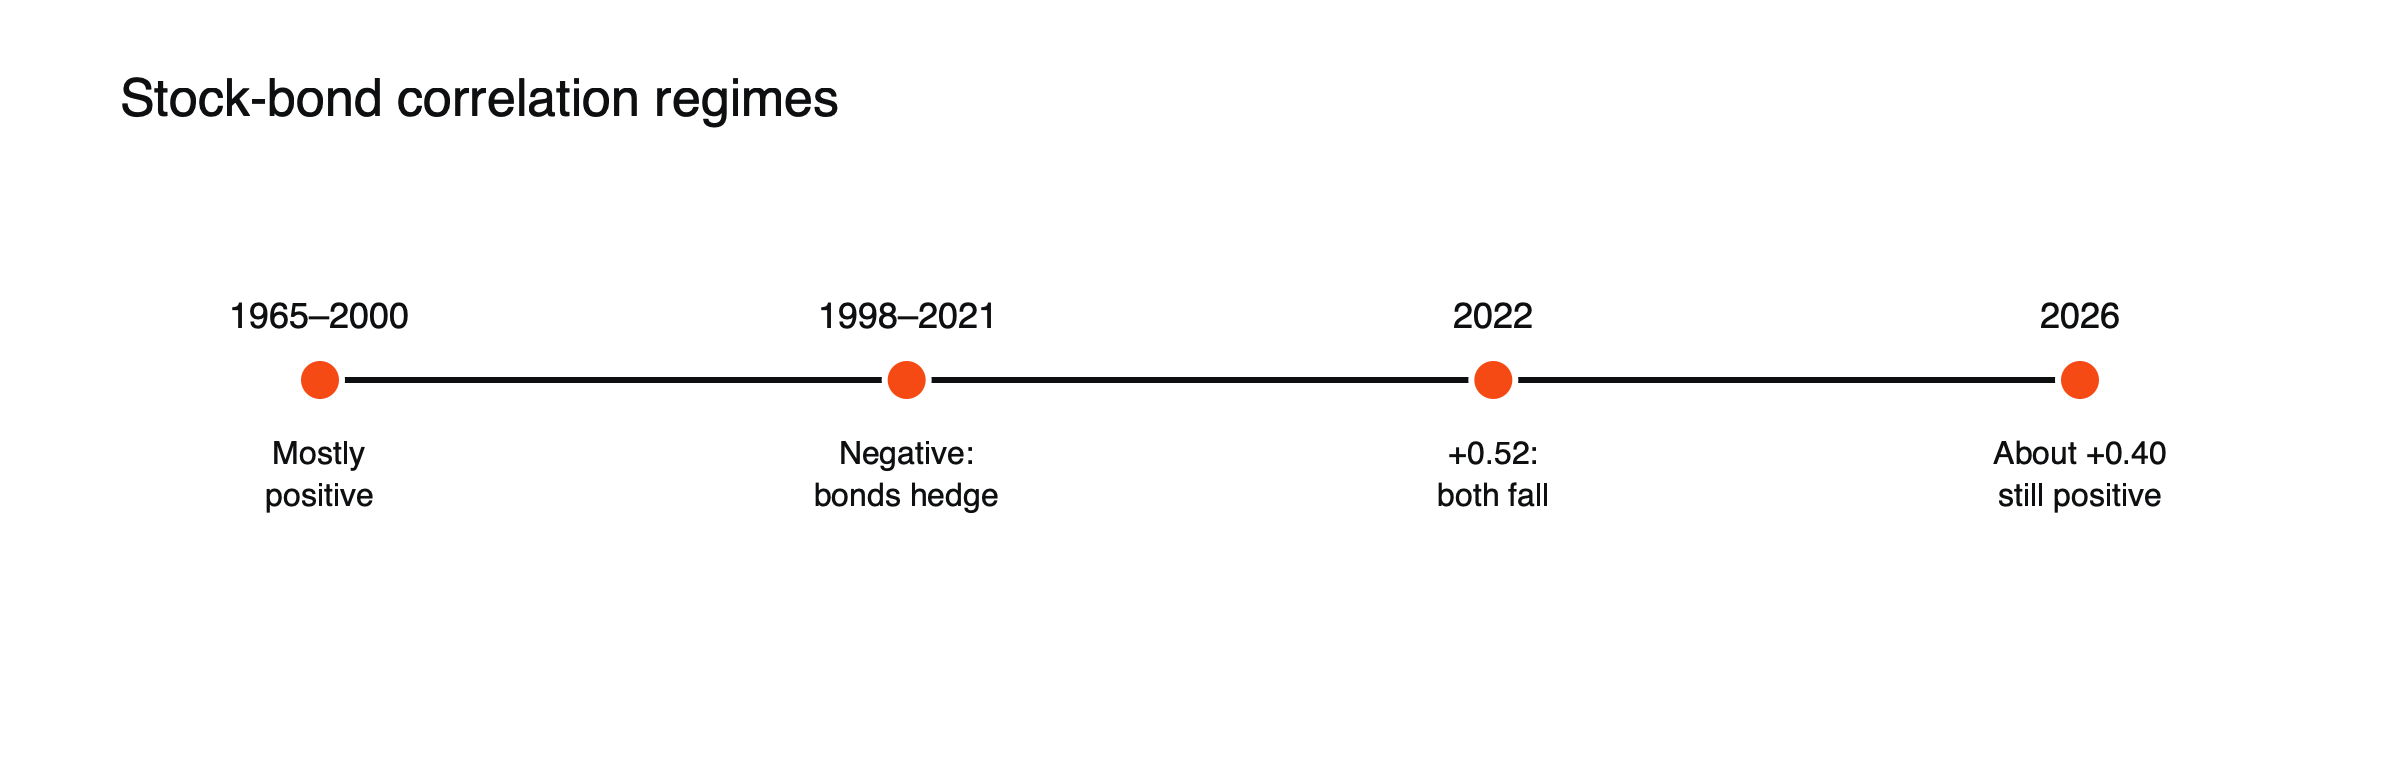
Figure: The stock-bond relationship has flipped before.
What correlation measures
Correlation runs from −1, when two assets always move in opposite directions, to +1, when they always move together. Investors usually measure the stock-bond correlation on rolling windows of daily, weekly or monthly returns, often over one to three years. A negative reading means bonds tend to rise when shares fall, cushioning a balanced portfolio; a positive reading means both tend to fall together, removing that cushion.
Why it flipped
When inflation is the risk, rate expectations drive both markets: higher rates reduce bond prices and the present value of company profits at the same time. When growth is the risk and inflation is low, central banks can cut rates in a downturn, lifting bonds as stocks fall.
The mechanism, illustrated
Suppose investors suddenly expect inflation to run 1 point higher than before. (Illustrative scenario.) Bond yields rise to compensate, cutting bond prices. The same higher yields raise the rate used to value company profits, lowering share prices, especially for growth companies. Both fall. Now suppose instead investors expect growth to slow sharply while inflation stays low: expected rate cuts push bond yields down and prices up, while lower profit expectations push shares down. They move in opposite directions. The type of shock decides the sign.
14 months together
In 2022, shares and bonds fell together for 14 consecutive months, an unusually long stretch. A typical 60/40 portfolio lost roughly 17%, its worst year since 1937. The length of the joint decline, not just its depth, made it harder for investors who had relied on bonds to offset share losses.
What it means and whether it will flip back
Bonds became a weaker hedge in inflation-driven sell-offs. Some investors added assets that held up better in 2022, such as commodities, which rose while both stocks and bonds fell. See commodities vs stocks during inflationary periods.
If inflation settles low and stable, the negative correlation could return; some analysts, including at the IMF, think the shift may be more lasting in a world of recurring inflation shocks. See stocks, bonds and commodities across the rate cycle, stocks vs bonds when inflation is falling and what 2022 taught investors about diversification.
Signals to watch
- Inflation volatility: stable inflation near target has coincided with negative correlation; volatile inflation with positive correlation.
- Central bank credibility: confidence that inflation will be controlled allows bonds to rally in downturns.
- Starting yields: higher yields give bonds more room to fall in price but also more income to cushion losses.
- The rolling correlation itself: published by many data providers and worth checking every few months.
Portfolio responses, illustrated
Suppose an investor who held 60% shares and 40% long bonds moves to 60% shares, 25% bonds split between short and long maturities, 10% inflation-linked bonds and 5% commodities. (Illustrative mix, not a recommendation.) In a growth scare, the long bonds still cushion share losses; in an inflation shock, the short bonds, inflation-linked bonds and commodities hold up better. The aim is to reduce reliance on any single relationship. See what 2022 taught investors about diversification.
The correlation in 2026
By 2026, the correlation remained positive, around +0.40 on one measure, as inflation stayed above many central banks’ targets and markets remained sensitive to inflation data. Higher bond yields meant bonds offered more income than before 2022, but their reliability as a share hedge had not fully returned. See stocks vs bonds when inflation is falling.
Why 1998 to 2021 was unusual
The long stretch of negative correlation coincided with an unusual environment: inflation low and stable, central banks credible and willing to cut aggressively in downturns, and a long decline in interest rates. In that world, the main threat to shares was weak growth, which also lowered bond yields. Many investors came to treat the negative correlation as a law of markets, but history before 1998 suggests it was a feature of that particular regime.
Crisis spikes versus regime shifts
Short-lived jumps in the correlation, such as in March 2020 when investors sold everything for cash, differ from lasting regime shifts, such as 2022. The first reverse within days or weeks as central banks restore liquidity; the second persist as long as inflation remains the dominant risk. Telling them apart matters for deciding whether to adjust a portfolio. See why correlations go to one in a crisis.
Risk parity and leverage
Some strategies, known as risk parity, hold leveraged bond positions alongside shares, relying on the negative correlation to keep overall risk balanced. When the correlation turned positive in 2022, these strategies suffered heavily, because both legs fell at once. Their experience showed how much modern portfolio design had relied on the old relationship.
Other countries
The same pattern appeared in other developed markets in 2022, as inflation surged across Europe and the UK. Countries with less credible inflation records have often seen positive correlations for longer.
Common misreadings
- Treating the correlation as fixed.
- Reading a one-week spike as a regime change.
Measuring it yourself, illustrated
Take monthly returns for a share index and a government bond index over the past three years, 36 pairs of numbers, and calculate their correlation with a spreadsheet function. (Illustrative method.) A result of −0.3 means bonds have tended to offset share moves; +0.4 means they have tended to move together. Recalculating every quarter shows whether the relationship is shifting, and using weekly or daily returns gives faster but noisier readings.
What could turn it negative again
A return to low, stable inflation near central bank targets, with markets confident that central banks would cut rates aggressively in a downturn, would likely restore the negative correlation. A deep growth scare without inflation pressure could also produce it temporarily, as bonds rally on expected cuts while shares fall. Persistent inflation shocks, heavy government borrowing or doubts about central bank independence would push the other way.
Correlation and portfolio risk, illustrated
Suppose shares have volatility of 16% a year and bonds 6%, held 60/40. (Illustrative figures.) With a correlation of −0.3, the portfolio’s volatility is about 9.2%. With a correlation of +0.5, it rises to about 11.0%. The same holdings carry noticeably more risk when the correlation turns positive, which is why the shift in 2022 mattered so much for balanced portfolios.
How professional investors responded
Many institutions reviewed their asset allocation after 2022. Some added commodities, inflation-linked bonds or trend-following strategies; others shortened bond durations or held more cash. Pension funds and endowments also stress-tested portfolios against scenarios in which shares and bonds fall together, rather than relying on historical correlations from the low-inflation era.
The correlation and bond duration
When the correlation is positive, long-dated bonds add the most risk to a balanced portfolio, because they fall furthest in an inflation shock. Shortening bond duration reduces that risk while keeping some cushion for growth scares. When the correlation is negative, long bonds provide the strongest offset to share losses. Matching bond duration to the prevailing correlation regime is one practical way investors respond to the shift, though changing it too often can turn a portfolio decision into a costly attempt to time markets. Gradual adjustments, reviewed once or twice a year, are enough.
Frequently asked questions
Does a positive correlation mean bonds are useless?
No. Bonds still provide income and can rally in growth scares, but they are less reliable as a hedge when inflation is the main risk.
Can the correlation change quickly?
It can shift within months when the dominant risk changes, as it did in 2022.
This article is educational content and does not constitute financial, investment, legal or tax advice. Digital assets are volatile and you may lose the amount you invest.
Sources
- Stock-Bond Return Correlation Flips Positive (1998–2021 range; +0.52 in 2022; 2008 hedge; about +0.40 in 2026) — Voronoi
- The death of the 60/40 (worst year since 1937; 14 consecutive months of joint declines) — Masterworks Research, June 2026
- The 60/40 Portfolio (correlation positive from about 1965 to 2000) — BIT Knowledge Hub
- 60/40 in 2022 (IMF view that the shift may be structural) — The Edge Malaysia, September 2026